


XRP Price Could Successfully Sustain Above $0.60 This Time
XRP has recorded a significant 14% rise over the past week, pushing the cryptocurrency closer to the crucial $0.60 level. Historically, XRP has faced difficulty maintaining momentum above this mark.
While the recent rally shows promise for further gains, it’s unclear if XRP can sustain this upward trend. Its ability to hold above key resistance levels will determine whether this momentum can continue.
XRP Is Bound for a Breach
The Relative Strength Index (RSI), a widely used momentum indicator, shows strong bullish momentum for the XRP price. Currently sitting at a month-and-a-half high, the RSI suggests that the cryptocurrency has enough strength to continue its rise. A higher RSI often signals increased buying pressure.
As long as the RSI remains elevated, buyers will be driving the market, potentially helping XRP maintain its upward trajectory. However, sustained growth above the $0.60 mark will depend on continued support and broader market conditions, especially as XRP approaches this critical resistance level once again.
Read more: XRP ETF Explained: What It Is and How It Works
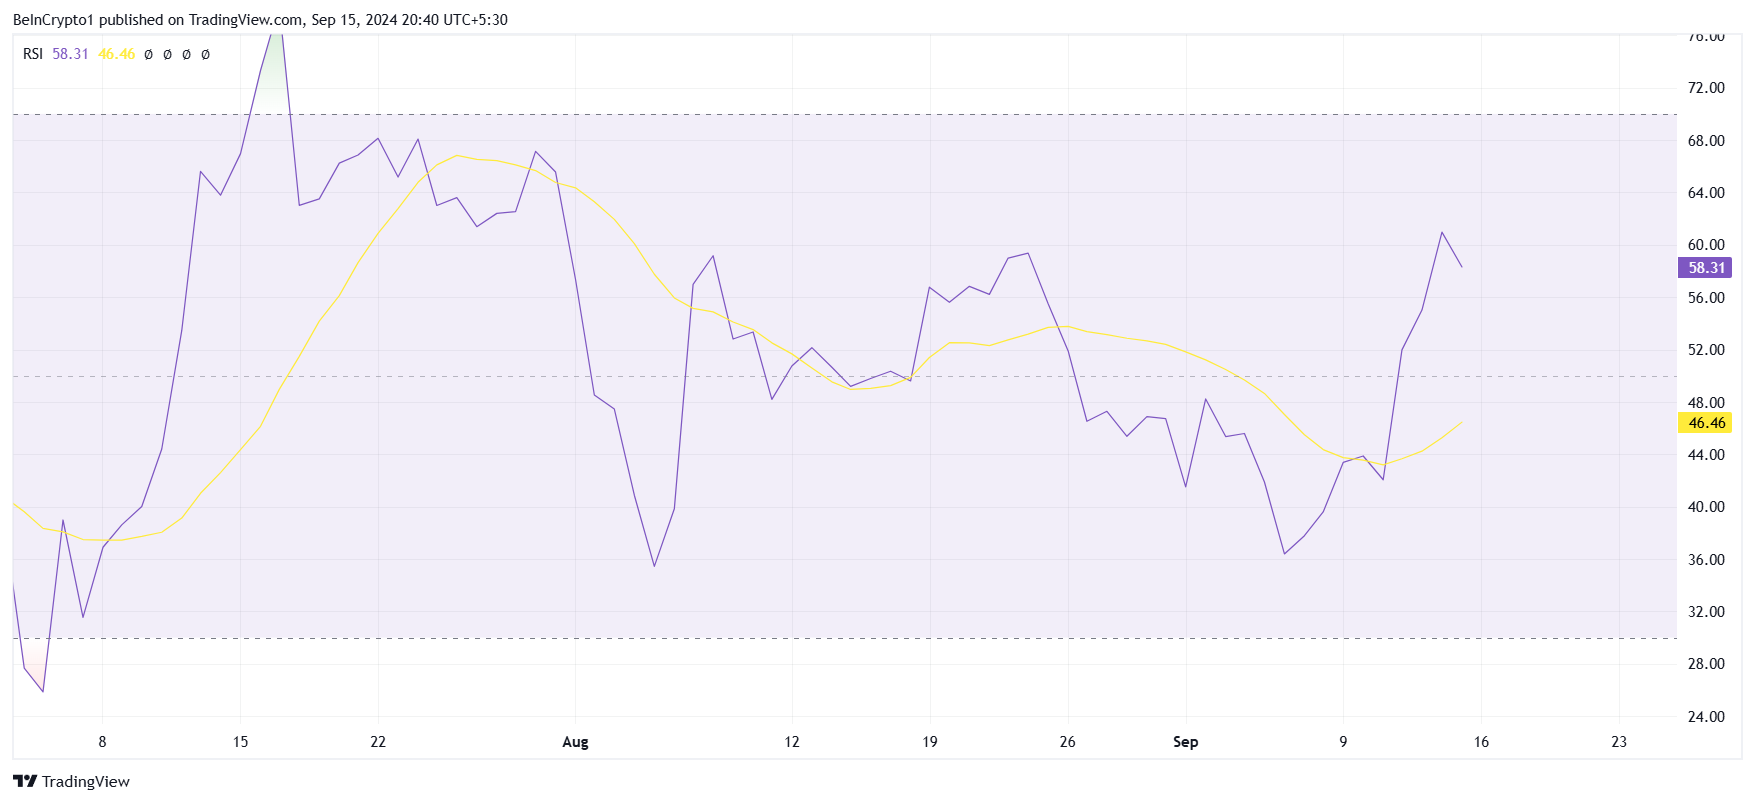 XRP RSI. Source: TradingView
Furthermore, XRP’s macro momentum is also showing signs of improvement, particularly with the Sharpe Ratio turning positive. The Sharpe Ratio is an indicator that measures the potential risk-adjusted returns of an asset.
A positive Sharpe Ratio suggests that the reward of buying XRP outweighs the risks, making it an attractive option for investors at the moment. This bullish signal could provide the necessary fuel for XRP to push higher.
With the Sharpe Ratio in positive territory, the market conditions seem favorable for buying, which could, in turn, drive XRP’s price up.
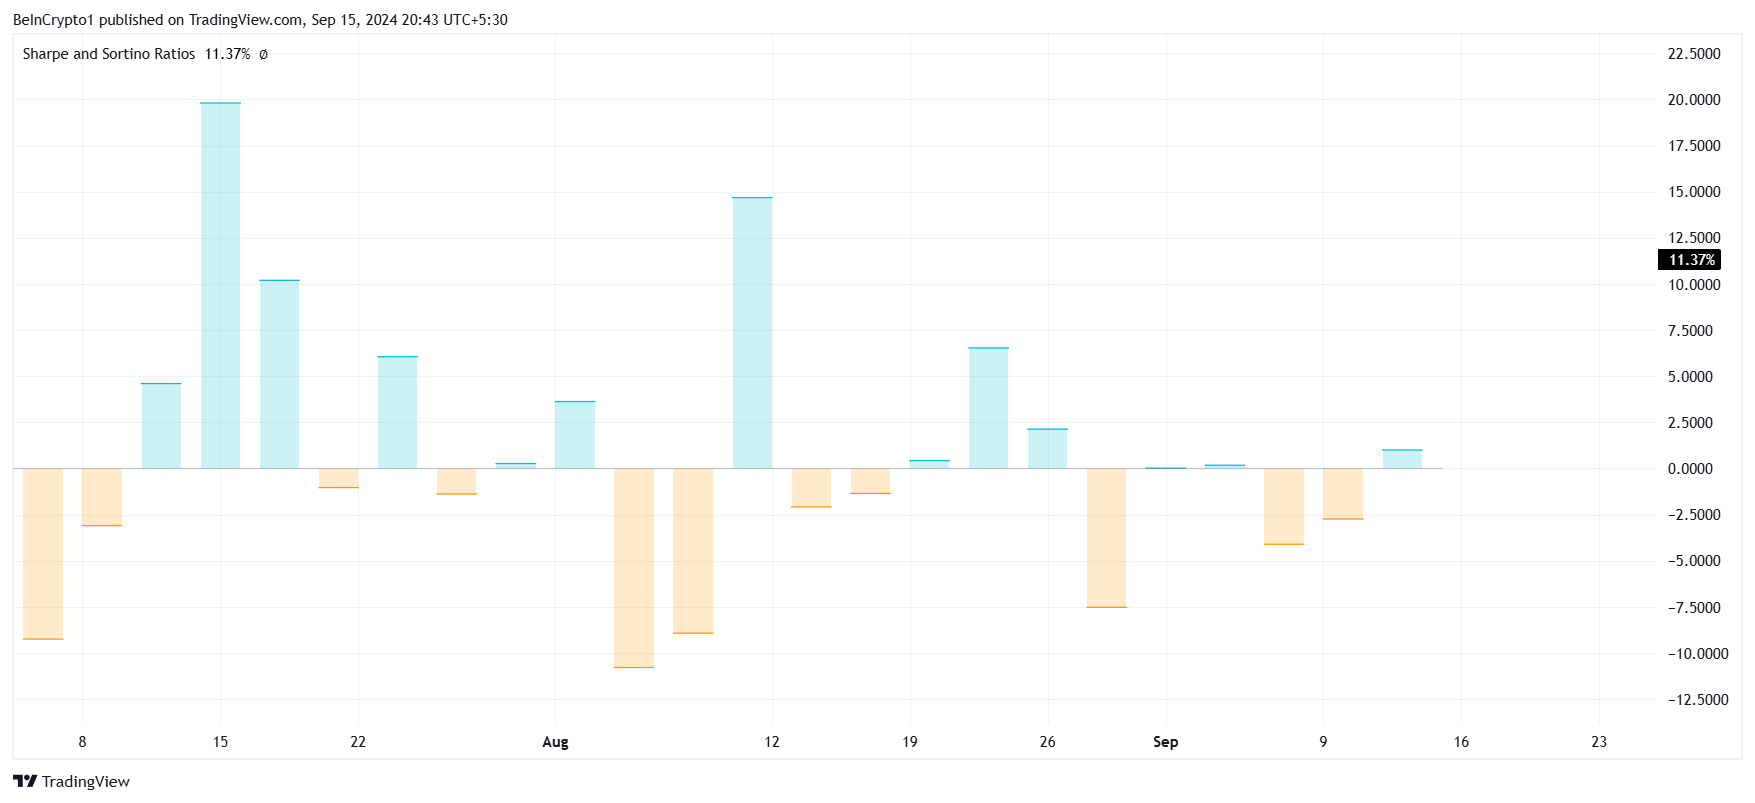 XRP Sharpe Ratio. Source: TradingView
XRP Price Prediction: One Resistance at a Time
XRP price’s recent 14% rise has brought the cryptocurrency to $0.58, a level just shy of the crucial $0.60 mark. The altcoin is also nearing the 50% Fibonacci Retracement line, which coincides with this price point.
Breaching this level could serve as a signal that XRP is poised for further gains, possibly reaching $0.70 in the near future. Historically, XRP has faced challenges maintaining momentum beyond $0.60, but current indicators suggest it may have a better chance this time around.
If the cryptocurrency can flip $0.60 into support, a rally toward $0.70 could be on the cards.
Read more: Ripple (XRP) Price Prediction 2024/2025/2030
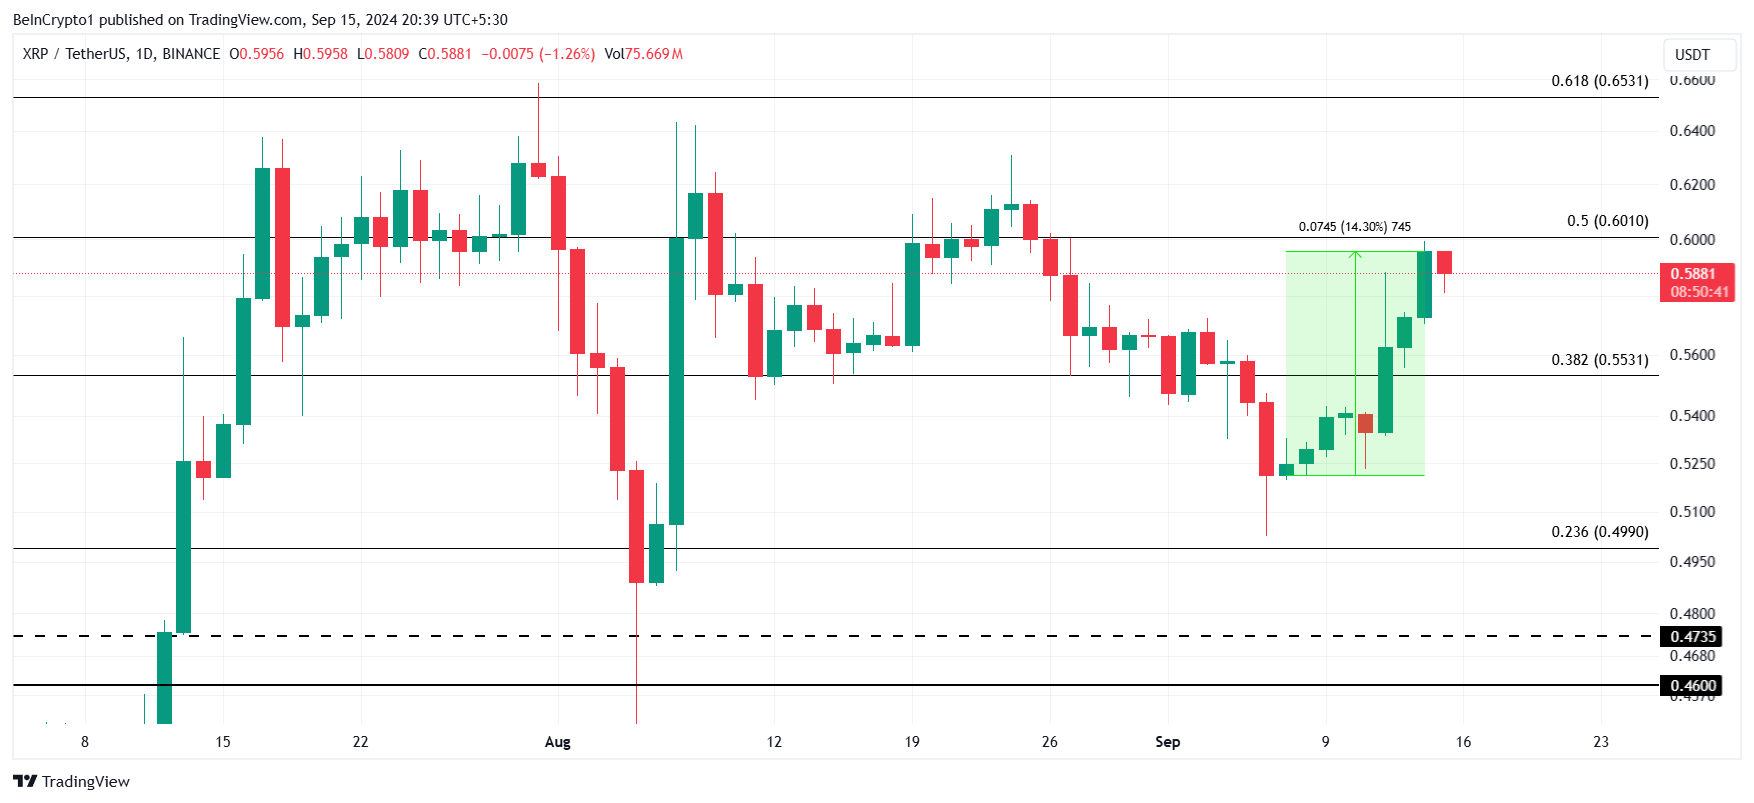 XRP Price Analysis. Source: TradingView
However, if history repeats itself, XRP could breach $0.60 only to fall back down again. A failure to sustain above this level could lead to a pullback, with prices potentially dropping to $0.55. Such a scenario would invalidate the current bullish thesis.
Recommended Articles


