
XRP rallies past $0.50, resists decline after Ripple traders realized nearly $40 million in losses
- Ripple traders shed their holdings at nearly $40 million loss in the crypto market crash on Monday.
- XRP noted a decline in address activity as traders lost interest after mass sell-off.
- XRP sustained above $0.50 on August 7, nearly a 10% decline is likely.
Ripple (XRP) made a comeback above key support at $0.50 after the recent correction in the crypto market. On-chain data shows traders losing interest in the altcoin after a massive sell-off event on August 5.
Santiment data shows traders realized millions in losses, a likely sign of capitulation.
Daily digest market movers: Ripple traders dump holdings at a loss
- Santiment data shows Ripple holders shed their XRP at $38.3 million in losses on Wednesday, the single largest capitulation event in the altcoin since May 1, 2024.
- The Network Realized Profit/Loss metric measures the net profit/loss realized by all traders who moved the asset on a given day. The large negative spike on August 5 is, therefore, indicative of the losses realized on the day of the massive crypto crash on Monday.
- XRP traders have realized gains since then, per NPL data from Santiment.
 [22.42.25, 07 Aug, 2024]-638586512333603293.png)
XRP NPL vs. price
- The address activity metric used to track demand for the asset and trader interest shows a decline since the correction. This supports a bearish thesis for the asset, per Santiment data.
 [22.43.14, 07 Aug, 2024]-638586512664495273.png)
XRP active addresses vs. price
- Ripple announced its $10 million investment in tokenized US Treasury bills, RippleX Bug Bounty Program and partnership with DIFC Innovation Hub. Despite the series of positive announcements, the altcoin's price remains stuck around the resistance at $0.50.
Technical analysis: XRP could extend losses by nearly 10%
Ripple is in a downward trend that started on July 19, 2023, and since then the asset has attempted to break out of the decline, with no success. XRP slipped to a low of $0.43 on August 5 and recovered above $0.50 early on Wednesday.
The Moving Average Convergence Divergence (MACD) indicator shows red histogram bars under the neutral line, meaning the underlying momentum in Ripple price is negative. XRP could extend losses by nearly 10% and slip to $0.45, the lower boundary of a Fair Value Gap (FVG) seen in the XRP/USDT daily chart.
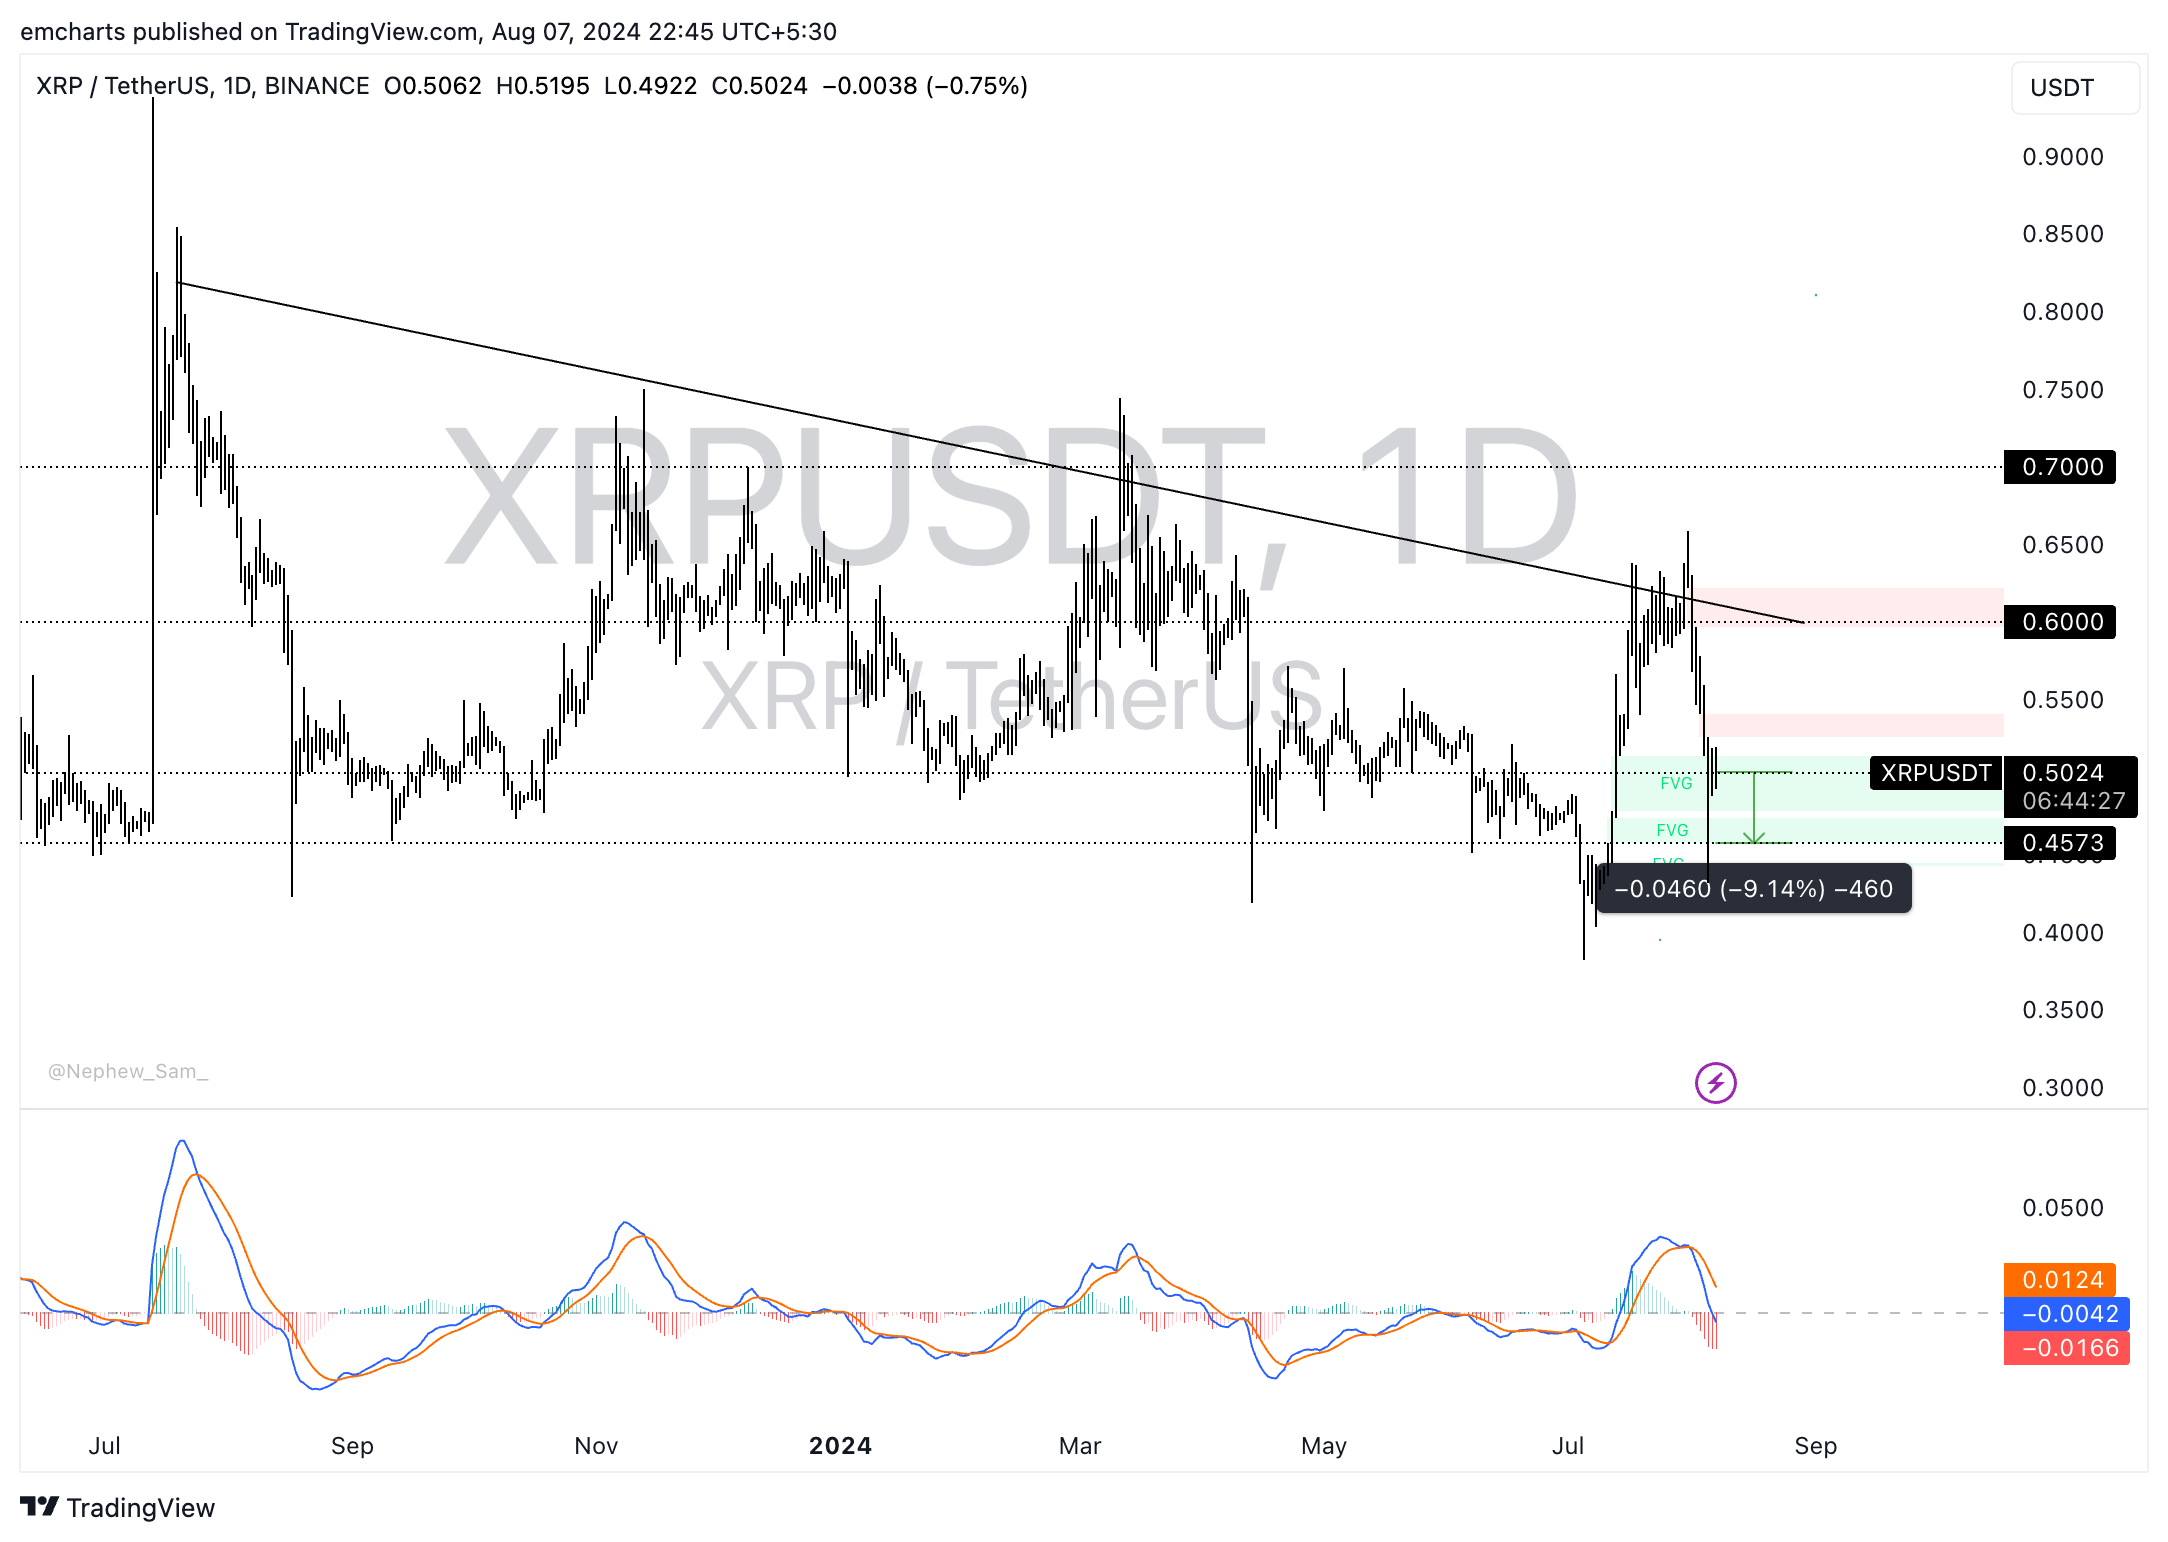
XRP/USDT daily chart
A daily candlestick close above $0.52 could invalidate the bearish thesis, and XRP could advance toward the $0.60 target.
Cryptocurrency metrics FAQs
The developer or creator of each cryptocurrency decides on the total number of tokens that can be minted or issued. Only a certain number of these assets can be minted by mining, staking or other mechanisms. This is defined by the algorithm of the underlying blockchain technology. Since its inception, a total of 19,445,656 BTCs have been mined, which is the circulating supply of Bitcoin. On the other hand, circulating supply can also be decreased via actions such as burning tokens, or mistakenly sending assets to addresses of other incompatible blockchains.
Market capitalization is the result of multiplying the circulating supply of a certain asset by the asset’s current market value. For Bitcoin, the market capitalization at the beginning of August 2023 is above $570 billion, which is the result of the more than 19 million BTC in circulation multiplied by the Bitcoin price around $29,600.
Trading volume refers to the total number of tokens for a specific asset that has been transacted or exchanged between buyers and sellers within set trading hours, for example, 24 hours. It is used to gauge market sentiment, this metric combines all volumes on centralized exchanges and decentralized exchanges. Increasing trading volume often denotes the demand for a certain asset as more people are buying and selling the cryptocurrency.
Funding rates are a concept designed to encourage traders to take positions and ensure perpetual contract prices match spot markets. It defines a mechanism by exchanges to ensure that future prices and index prices periodic payments regularly converge. When the funding rate is positive, the price of the perpetual contract is higher than the mark price. This means traders who are bullish and have opened long positions pay traders who are in short positions. On the other hand, a negative funding rate means perpetual prices are below the mark price, and hence traders with short positions pay traders who have opened long positions.
Recommended Articles


