

BONK price crash leads to half a million dollars in liquidations

Source Fxstreet
  • BONK price has dropped by more than 26% in the last eight days after rallying 56% in three days.
  • Traders witnessed long contracts worth $562,000 being liquidated on Thursday.
  • Bonk’s fallout will likely continue towards $0.0000100, a monthly low.

BONK price is reinforcing the bearish narrative for the meme coin market after disappointing runs from Dogecoin and Shiba Inu. The lack of growth has already stumped investors, and the ones optimistic about witnessing a recovery are being shot down by the bearish market conditions.

Bearish Bonk causes broad losses

The Solana-based meme coin Bonk has joined the leagues of cryptocurrencies that are failing to produce any profits for investors. Earlier on Wednesday, BONK witnessed a massive correction that led to many traders losing their money as open positions contracted.

Long liquidations in a single day hit $562,000 due to the price decline. As is, the investors have been wary of the meme coin owing to the slow recovery, and with consistent long liquidations, traders might refrain from betting on a recovery.
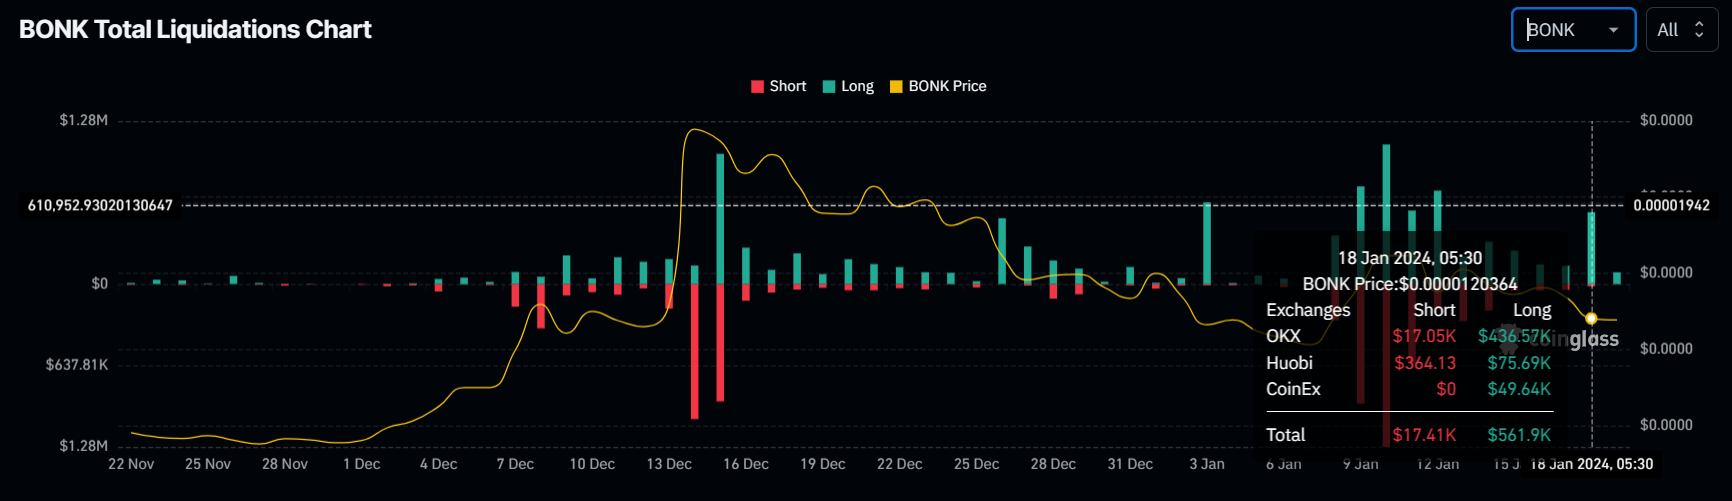
BONK long liquidations

BONK long liquidations

Long contracts signify that traders are expecting an increase in price, but when these expectations are invalidated over and over, these traders will begin holding back, reducing the bullish sentiment considerably.

BONK price decline could extend

BONK price trading at $0.00001189 is close to losing another support level marked at $0.00001137. In the last eight days, the meme coin has already declined by more than 26%, losing the psychological support level of $0.00001500.

The Relative Strength Index (RSI) is also currently below the neutral line, marked at 50.0 in the bearish neutral zone. This suggests that the decline could extend, and if the $0.00001137 support is lost, a crash to $0.00001000 is likely.
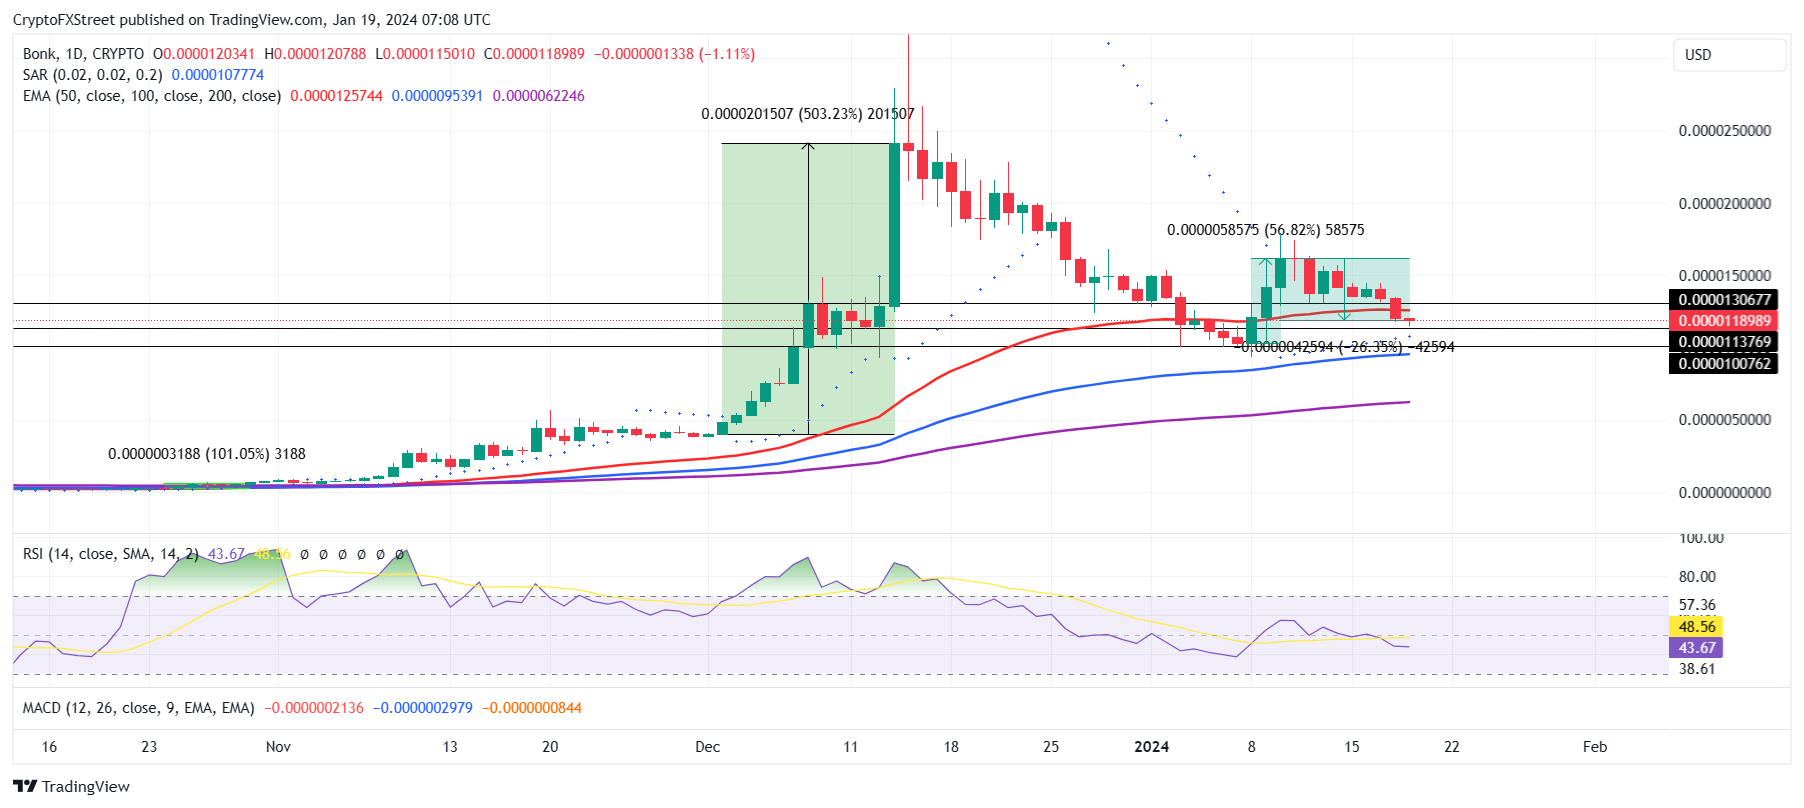
BONK/USD 1-day chart

BONK/USD 1-day chart

However, if the altcoin bounces back from the aforementioned support level, it could see potential recovery. This would be confirmed once the RSI flips the neutral line into a support floor. This would push BONK price beyond $0.00001306, invalidating the bearish thesis.

Disclaimer: For information purposes only. Past performance is not indicative of future results.
placeholder
WTI (USOIL) Is down 2.03% on Sep 25: Here Is WhyWTI (USOIL) is down 2.03% at Sep 24 22:20(UTC+0), now at $92.517, with a 7-day down of 3.63%.What is driving WTI (USOIL)’s stock price down today?The drop in WTI crude oil prices was primarily driven by
Author  TradingKey
13 hours ago
WTI (USOIL) is down 2.03% at Sep 24 22:20(UTC+0), now at $92.517, with a 7-day down of 3.63%.What is driving WTI (USOIL)’s stock price down today?The drop in WTI crude oil prices was primarily driven by
placeholder
Silver Price Forecast: XAG/USD remains steady near $64.00 as oil prices easeSilver price (XAG/USD) inches higher after two days of losses, trading around $63.90 per troy ounce during Asian hours on Friday. Non-yielding Silver is finding underlying support as inflation concerns ease following a pullback in crude oil prices.
Author  FXStreet
15 hours ago
Silver price (XAG/USD) inches higher after two days of losses, trading around $63.90 per troy ounce during Asian hours on Friday. Non-yielding Silver is finding underlying support as inflation concerns ease following a pullback in crude oil prices.
placeholder
Gold Price Forecast: Gold Drops Below $4,300, Will It Continue to Fall? As of the European session on September 24, gold prices (XAUUSD) extended their correction, dipping below $4,300 intraday to hit a low of $4,262.45. After previously rebounding close to $
Author  TradingKey
Yesterday 09: 57
As of the European session on September 24, gold prices (XAUUSD) extended their correction, dipping below $4,300 intraday to hit a low of $4,262.45. After previously rebounding close to $
placeholder
Yen touches 158.37 as Tokyo reopens, then slips back — ¥15.4 trillion of intervention and the 200-day line stand between here and 160USD/JPY reached 158.37 overnight, its highest since early September, then eased to 157.88 as Japanese markets reopened after a three-day holiday. The Ministry of Finance has spent ¥15.4 trillion defending the yen since late July and the BOJ ran a rate check on September 18. The 200-day average sits at 158.43.
Author  Irene Q.
Yesterday 06: 59
USD/JPY reached 158.37 overnight, its highest since early September, then eased to 157.88 as Japanese markets reopened after a three-day holiday. The Ministry of Finance has spent ¥15.4 trillion defending the yen since late July and the BOJ ran a rate check on September 18. The 200-day average sits at 158.43.
placeholder
US input costs rose at the fastest pace in four years — the September flash PMI beat is an inflation story, not a growth storyUS September flash PMIs came in far above expectations, with the composite at 58.4, a five-year high. But the detail that moved markets was input cost inflation at its fastest since October 2022, driven by fuel, transport and supply shortages. Brent is back above $100 and the 10-year Treasury yield has hit its highest since 2007.
Author  Suzie
Yesterday 06: 46
US September flash PMIs came in far above expectations, with the composite at 58.4, a five-year high. But the detail that moved markets was input cost inflation at its fastest since October 2022, driven by fuel, transport and supply shortages. Brent is back above $100 and the 10-year Treasury yield has hit its highest since 2007.
Related Instrument
goTop
quote