


Last Resistance: Bitcoin Now Testing Final Short-Term Holder Cost Basis
On-chain data shows that the Bitcoin price reiterates the last cost basis level associated with the short-term holder group.
Bitcoin Price Has Surged Past Final Short-Term Holder Cost Basis
As explained by CryptoQuant author Axel Adler Jr in a new post on X, Bitcoin has only one Realized Price of the short-term holders left to break. The “Realized Price” here refers to an on-chain indicator that keeps track of the average cost basis of the investors in the BTC market.
Investors carry net profits when the cryptocurrency’s spot price is above this level. On the other hand, it being under the metric suggests the dominance of losses in the market.
In the context of the current discussion, the Realized Price of the entire market isn’t of interest but rather that of a small segment of it. The group in question is a section of the “short-term holders” (STHs), broadly including the investors who bought their coins within the past six months.
Below is the chart that shows the trend in the Realized Price specifically for the STHs who have been holding since between one and three months ago:
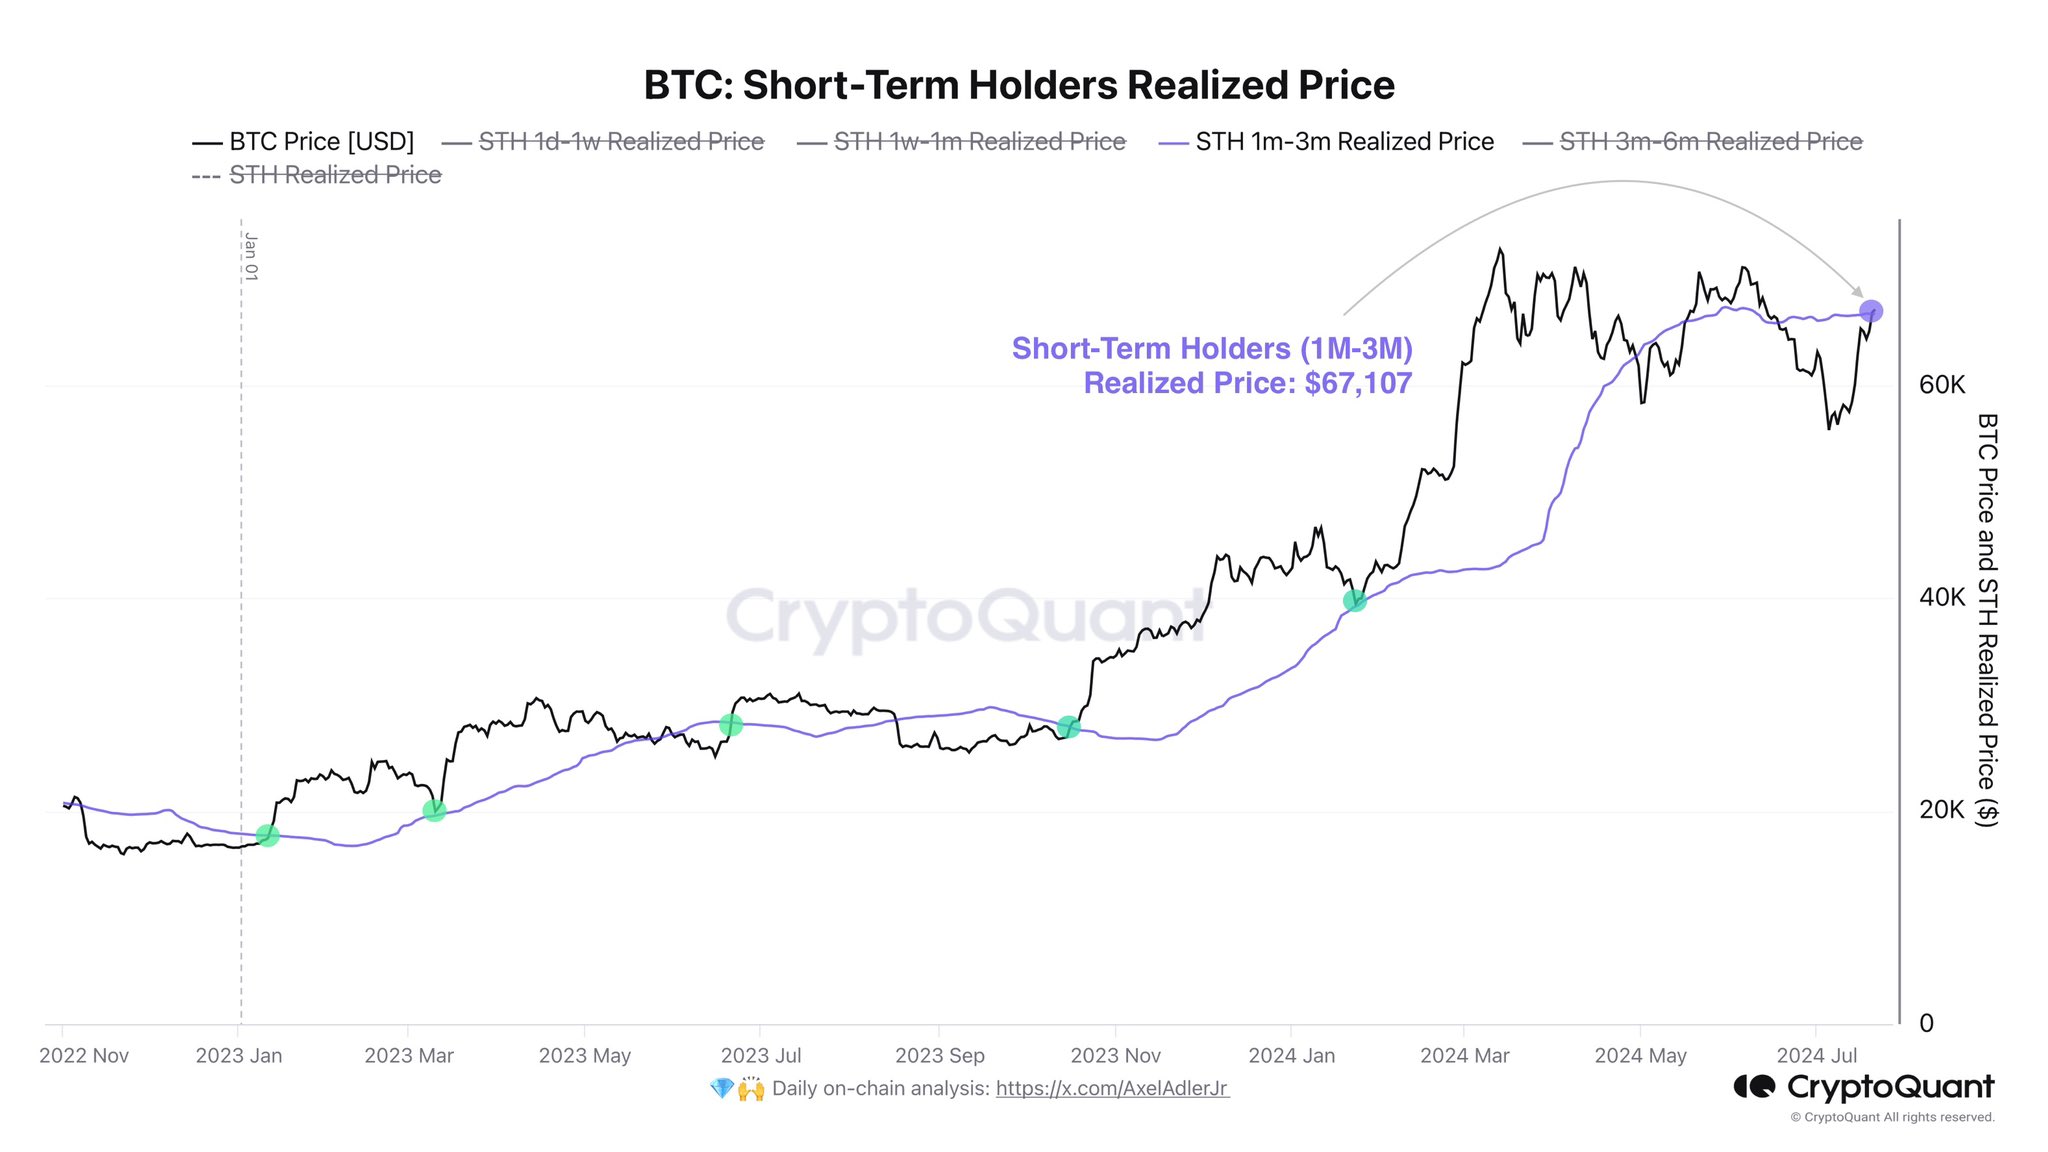
This segment of the STHs sits right in the middle of the group, between the newcomers who have just bought into the asset and those who have started to gain some resilience, with a promotion into the long-term holder (LTH) group potentially coming up for them.
According to the analyst, Bitcoin has already surged past the Realized price of the other two parts of the STH group, meaning that the investors falling in them would be in profits now.
The chart shows that the Realized Price of the 1 month to 3 months old investors, the one level BTC is yet to break, is valued at $67,100. This cryptocurrency price is currently floating around, suggesting that this cohort’s profits are canceling their losses.
The STH cost basis levels have historically been relevant for the cryptocurrency, as these investors, who are generally fickle-minded, are likely to show some reaction when the price retests their cost basis.
In bullish periods, these investors tend to buy at their own cost, while if the atmosphere is bearish, they may sell instead. As such, a successful break above this potential resistance boundary that Bitcoin is retesting right now could indicate the presence of bullish sentiment among the STHs.
BTC Price
At the time of writing, Bitcoin is trading at around $67,200, up almost 6% over the past week.
Recommended Articles


