
Bitcoin Whales Sold $1.7 Billion In BTC During Past Month: Data
On-chain data shows the Bitcoin whales took part in significant net distribution in the past month, potentially feeding into BTC’s bearish momentum.
Bitcoin Whales Have Been Selling Amid Bearish Market
As pointed out by analyst Ali in a new post on X, the BTC whales have been selling recently. The on-chain indicator of interest here is the “Supply Distribution” from the analytics firm Santiment, which keeps track of the total amount of Bitcoin that the various wallet groups are currently holding.
The addresses or investors are divided into these cohorts based on the number of tokens that they are carrying in their balance. The 1 to 10 coins group, for instance, includes all wallets holding between 1 and 10 BTC.
In the context of the current topic, the whale cohort is of focus, which typically comprises the holders who own between 1,000 and 10,000 BTC. At the current exchange rate, the lower end of this range converts to $55.4 million and the upper one to $554 million.
Thus, these investors have quite the large holdings. The influence of any entity on the market goes up the more they hold, so these humongous beings can carry some power. As such, their behavior can be worth keeping an eye on.
Here is the chart shared by the analyst that shows the trend in the Bitcoin Supply Distribution specifically for the whales over the past month or so:
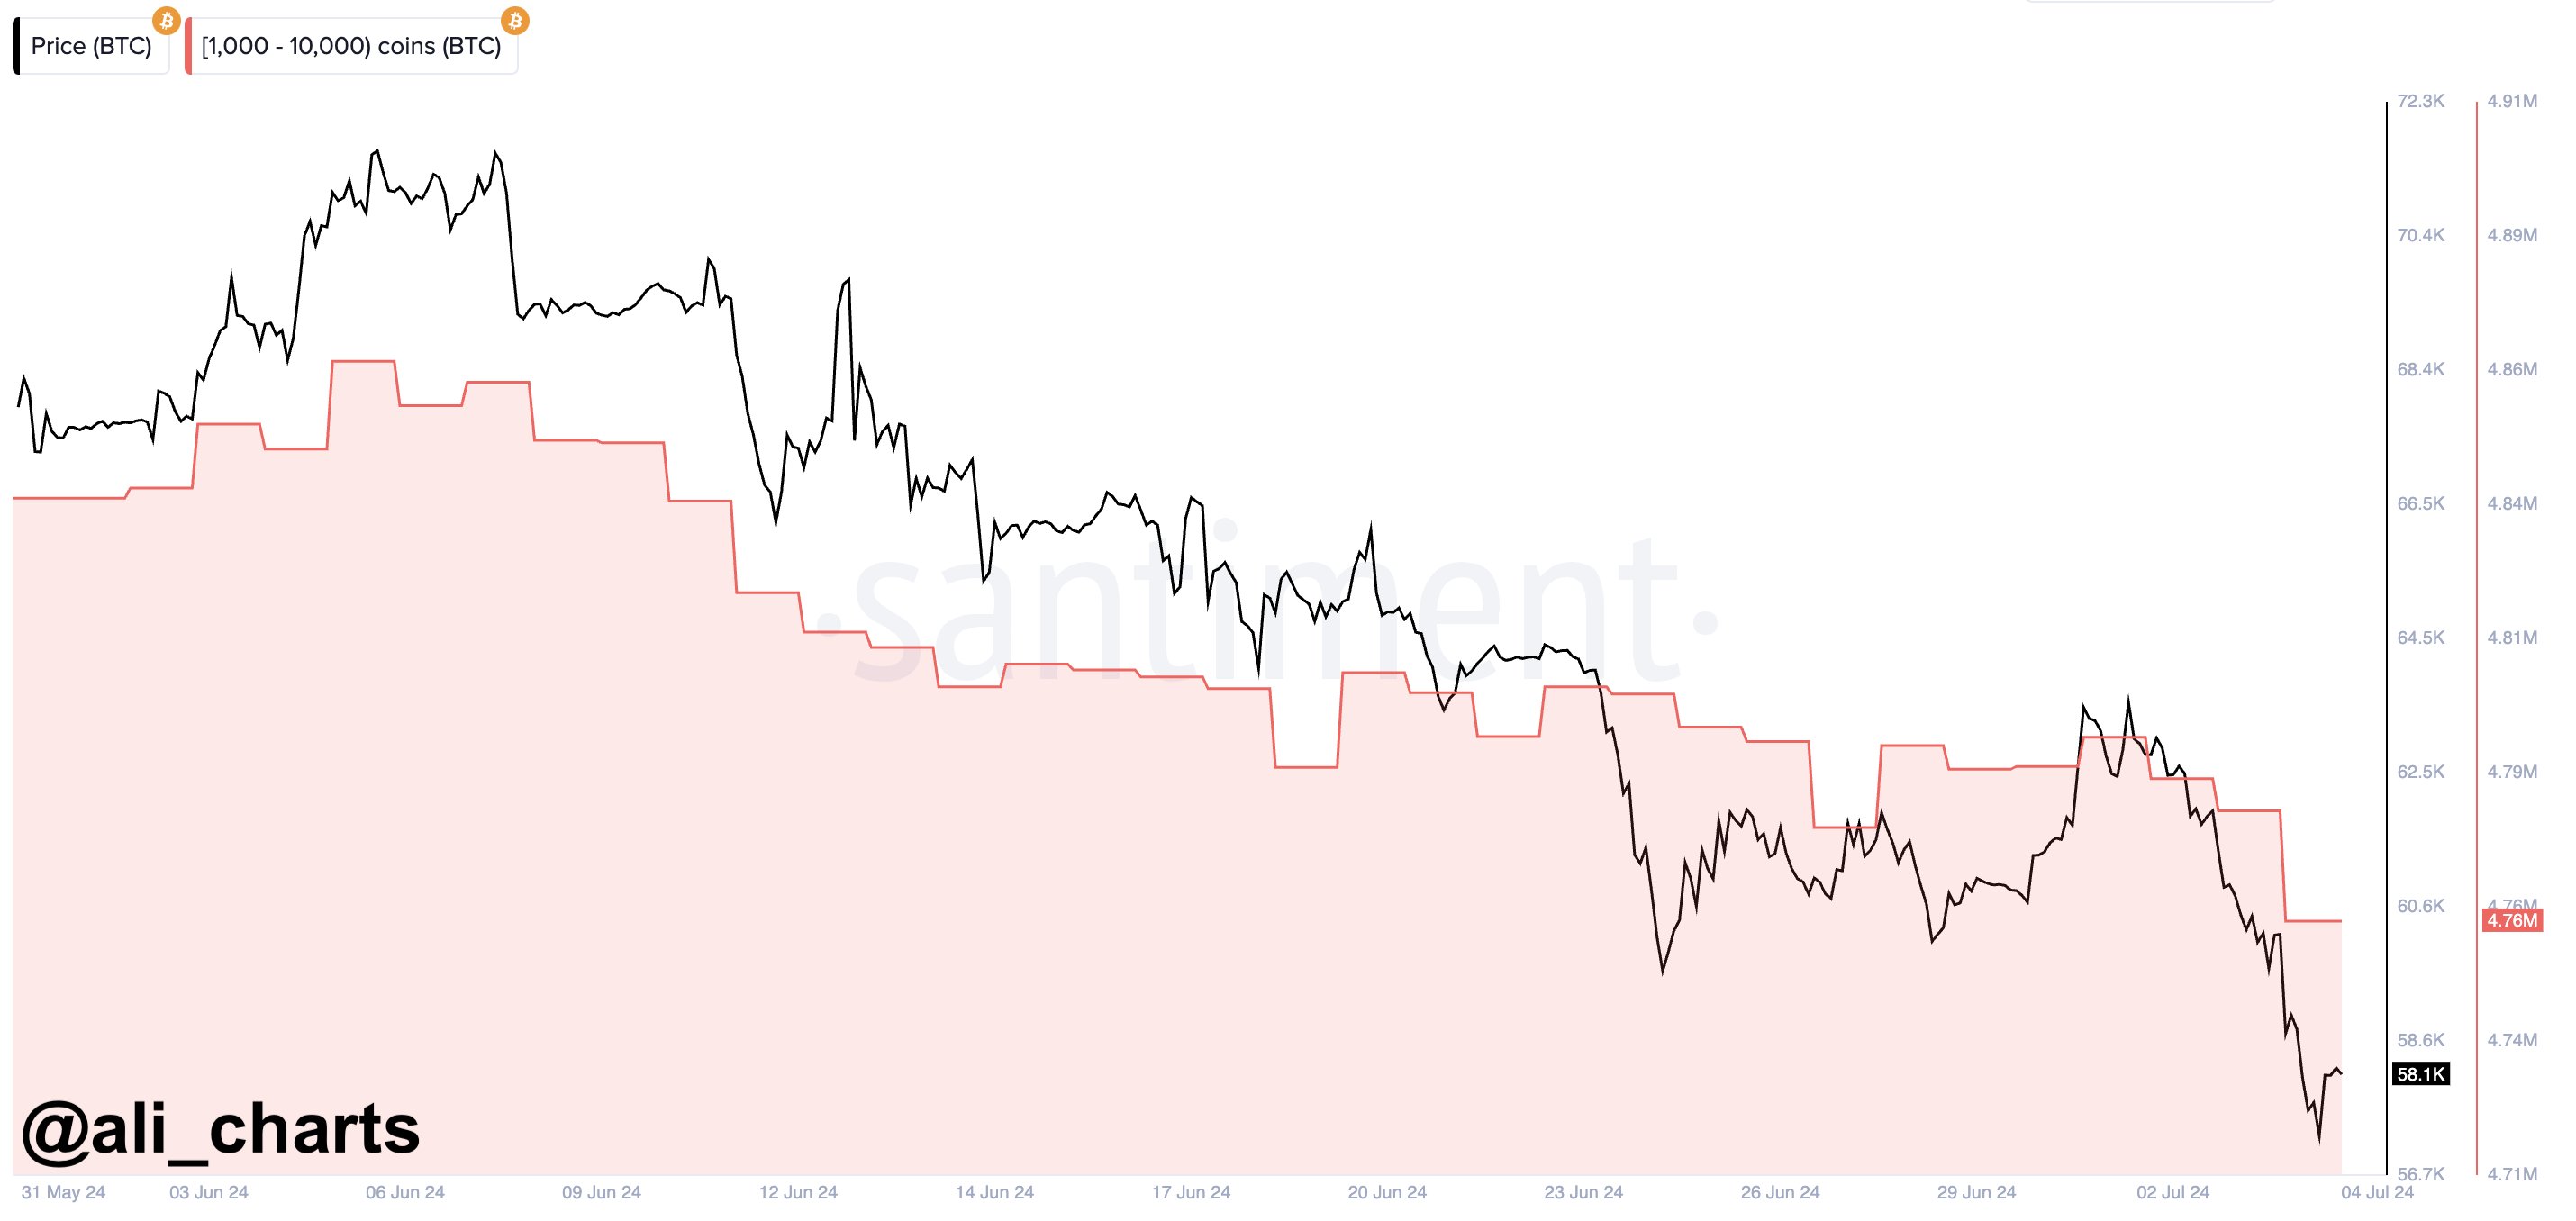
As is visible in the above graph, the Bitcoin Supply Distribution for the whales has been trending down during the past month. In total, these investors have shed a net 30,000 BTC, worth more than $1.65 billion right now.
The drawdown in the indicator has been particularly sharp in the past couple of days, suggesting that the selloff from these large entities is at least partly responsible for the crash the cryptocurrency has gone through.
While the whales have already participated in a significant amount of distribution, it’s hard to say whether their selling appetite has calmed down. It’s possible that more of these holders will feel anxious by the bearish market in the coming days and end up selling some of their bags.
Thus, the metric could be to watch in the near future, as further declines on it could spell the elongation of the drawdown for the cryptocurrency. Naturally, a reversal to the upside would be bullish instead, as it would imply the whales think the price has dropped deep enough to offer a profitable entry point.
BTC Price
Following a decline of more than 10% in the past week, Bitcoin has made its way to $55,000, a level that the cryptocurrency had only last been at in late February.
The below chart shows how the asset’s recent trajectory has looked like.
Recommended Articles


