
Bitcoin Cash faces potential 24% crash as Mt. Gox starts repayments
- Bitcoin Cash price trades below the weekly support level of $378.6, experiencing a 20% decline this week.
- Mt.Gox moves over 47,229 BTC worth $2.71 billion, signaling FUD in the market.
- A weekly candlestick close above $299.7 would invalidate the bearish thesis.
Bitcoin Cash has dropped below the weekly support level of $378.6, marking a 20% decline this week. Currently trading around $310, marking a 6% decline on the day. Trustee Nobuaki Kobayashi's announcement of Mt. Gox's repayment plan in early July, coupled with the movement of 47,229 BTC worth $2.71 billion on Friday, indicates market fear, uncertainty and doubt (FUD) that could potentially lead to a decline in BCH prices in the coming days.
Mt. Gox confirms Bitcoin, Bitcoin Cash repayments have begun
According to Arkham Intelligence, Mt. Gox recently transferred 47,229 BTC valued at $2.71 billion from the cold wallet 1HeHL. Of this, 2701.8 BTC worth $148.4 million was moved out of Mt. Gox wallets, with 1544.7 BTC worth $84.9 million sent to Bitbank via Mt. Gox address 1PKGG, and 1157.1 BTC ($63.6M) sent to an unknown counterparty bc1qkjc, likely an exchange handling repayments.
The Mt. Gox address 16ArP still holds 44,527 BTC. Including the BTC held in 16ArP, Mt. Gox wallets collectively contain 138,985 BTC worth $7.52 billion.
These movements are likely associated with the Mt. Gox repayments plan recently announced by Trustee Nobuaki Kobayashi.
UPDATE: Mt. Gox moving $2.71B BTC
— Arkham (@ArkhamIntel) July 5, 2024
In the past 8 hours, Mt. Gox wallets moved 47,229 BTC ($2.71B) from the cold wallet 1HeHL.
2701.8 BTC ($148.4M) was moved out of Mt. Gox wallets with 1544.7 BTC ($84.9M) sent to Bitbank through Gox address 1PKGG, and 1157.1 BTC ($63.6M) sent to… pic.twitter.com/sJEuJB7GwC
Bitcoin Cash faces potential 24% crash if it breaks below the $280 level
Bitcoin Cash has fallen below the weekly support level of $378.6, experiencing a 20% decline this week to test the support zone ranging from $299.7 to $280.6, significant for weekly and monthly support. At the time of writing, it trades down 6% on the day at the $310 area.
Additionally, the support zone roughly coincides with the ascending trendline drawn from joining multiple swing low levels between early June 2023 and early July 2024, as shown in the weekly chart below.
If BCH closes below the trendline, it could crash 24% from the point of the breakout to $210.10.
The Relative Strength Index (RSI) on the weekly chart has briefly slipped below the 50 mean level, while the Awesome Oscillator (AO) is on its way to doing the same. This suggests continued momentum favoring bears, potentially leading to a further decline in the Bitcoin Cash price.
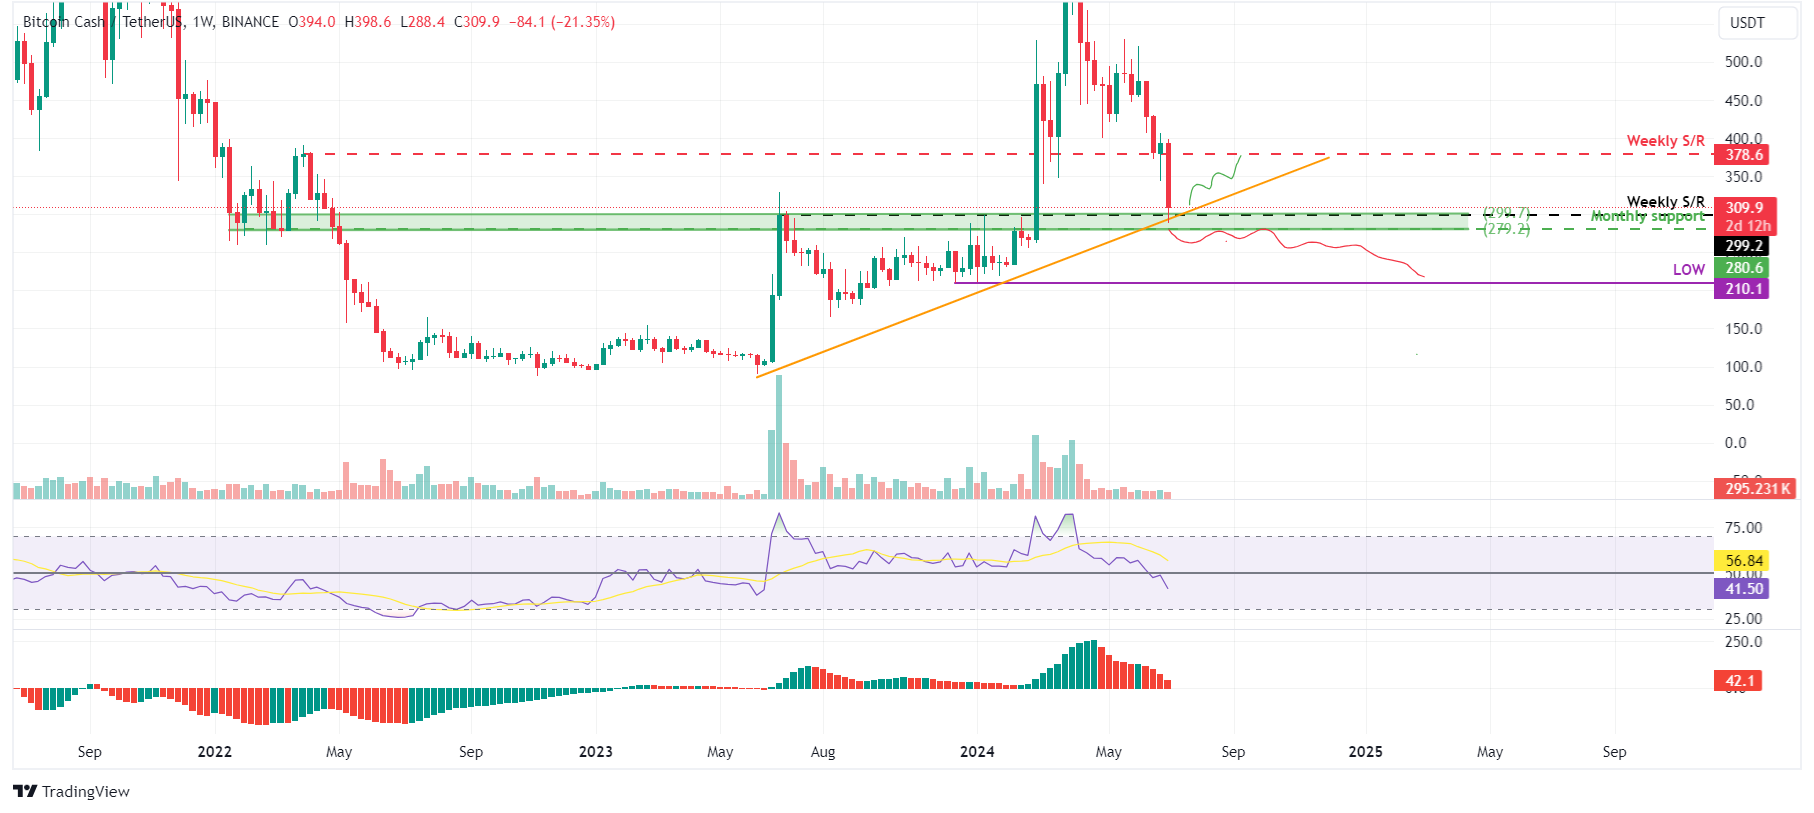
BCH/USDT weekly chart
However, if BCH closes above the trendline and finds support on the weekly level of $299.7, it could indicate that bullish sentiment could make a comeback. Such a development could trigger a 25% rally in Bitcoin Cash's price to revisit its weekly resistance at $378.6.
Recommended Articles


