
These Are The Altcoins In Buy Zone, Analytics Firm Reveals
The on-chain analytics firm Santiment has revealed the altcoins that are currently in the historical buy zone according to a fair value model.
A Large Amount Of Altcoins Are Currently Near The Opportunity Zone
In a new post on X, Santiment talked about what the various assets in the cryptocurrency sector are looking like right now based on their Market Value to Realized Value (MVRV) ratios. The MVRV ratio is an indicator that keeps track of the profit/loss status of the addresses on any given network.
When the value of this indicator is greater than 1, it means the investors are carrying a net amount of profits right now. On the other hand, the metric under this threshold implies the dominance of losses in the market.
Naturally, the MVRV ratio being exactly equal to 1 suggests the unrealized loss on the network is exactly equal to the unrealized profit, so the average holder could be considered just breaking even.
Historically, corrections have become more probable when investor profits have ballooned up. Holders become more tempted to sell the larger their gains grow. Similarly, holders getting underwater has facilitated bottom formations, as sellers become exhausted during such conditions.
Based on these facts, Santiment has developed an Opportunity and Danger Zone Model that uses the MVRV ratio’s divergence on different timeframes to estimate better whether an asset is currently providing a buying or selling window.
Now, here is the chart shared by the analytics firm that shows where the different altcoins stand according to this model:
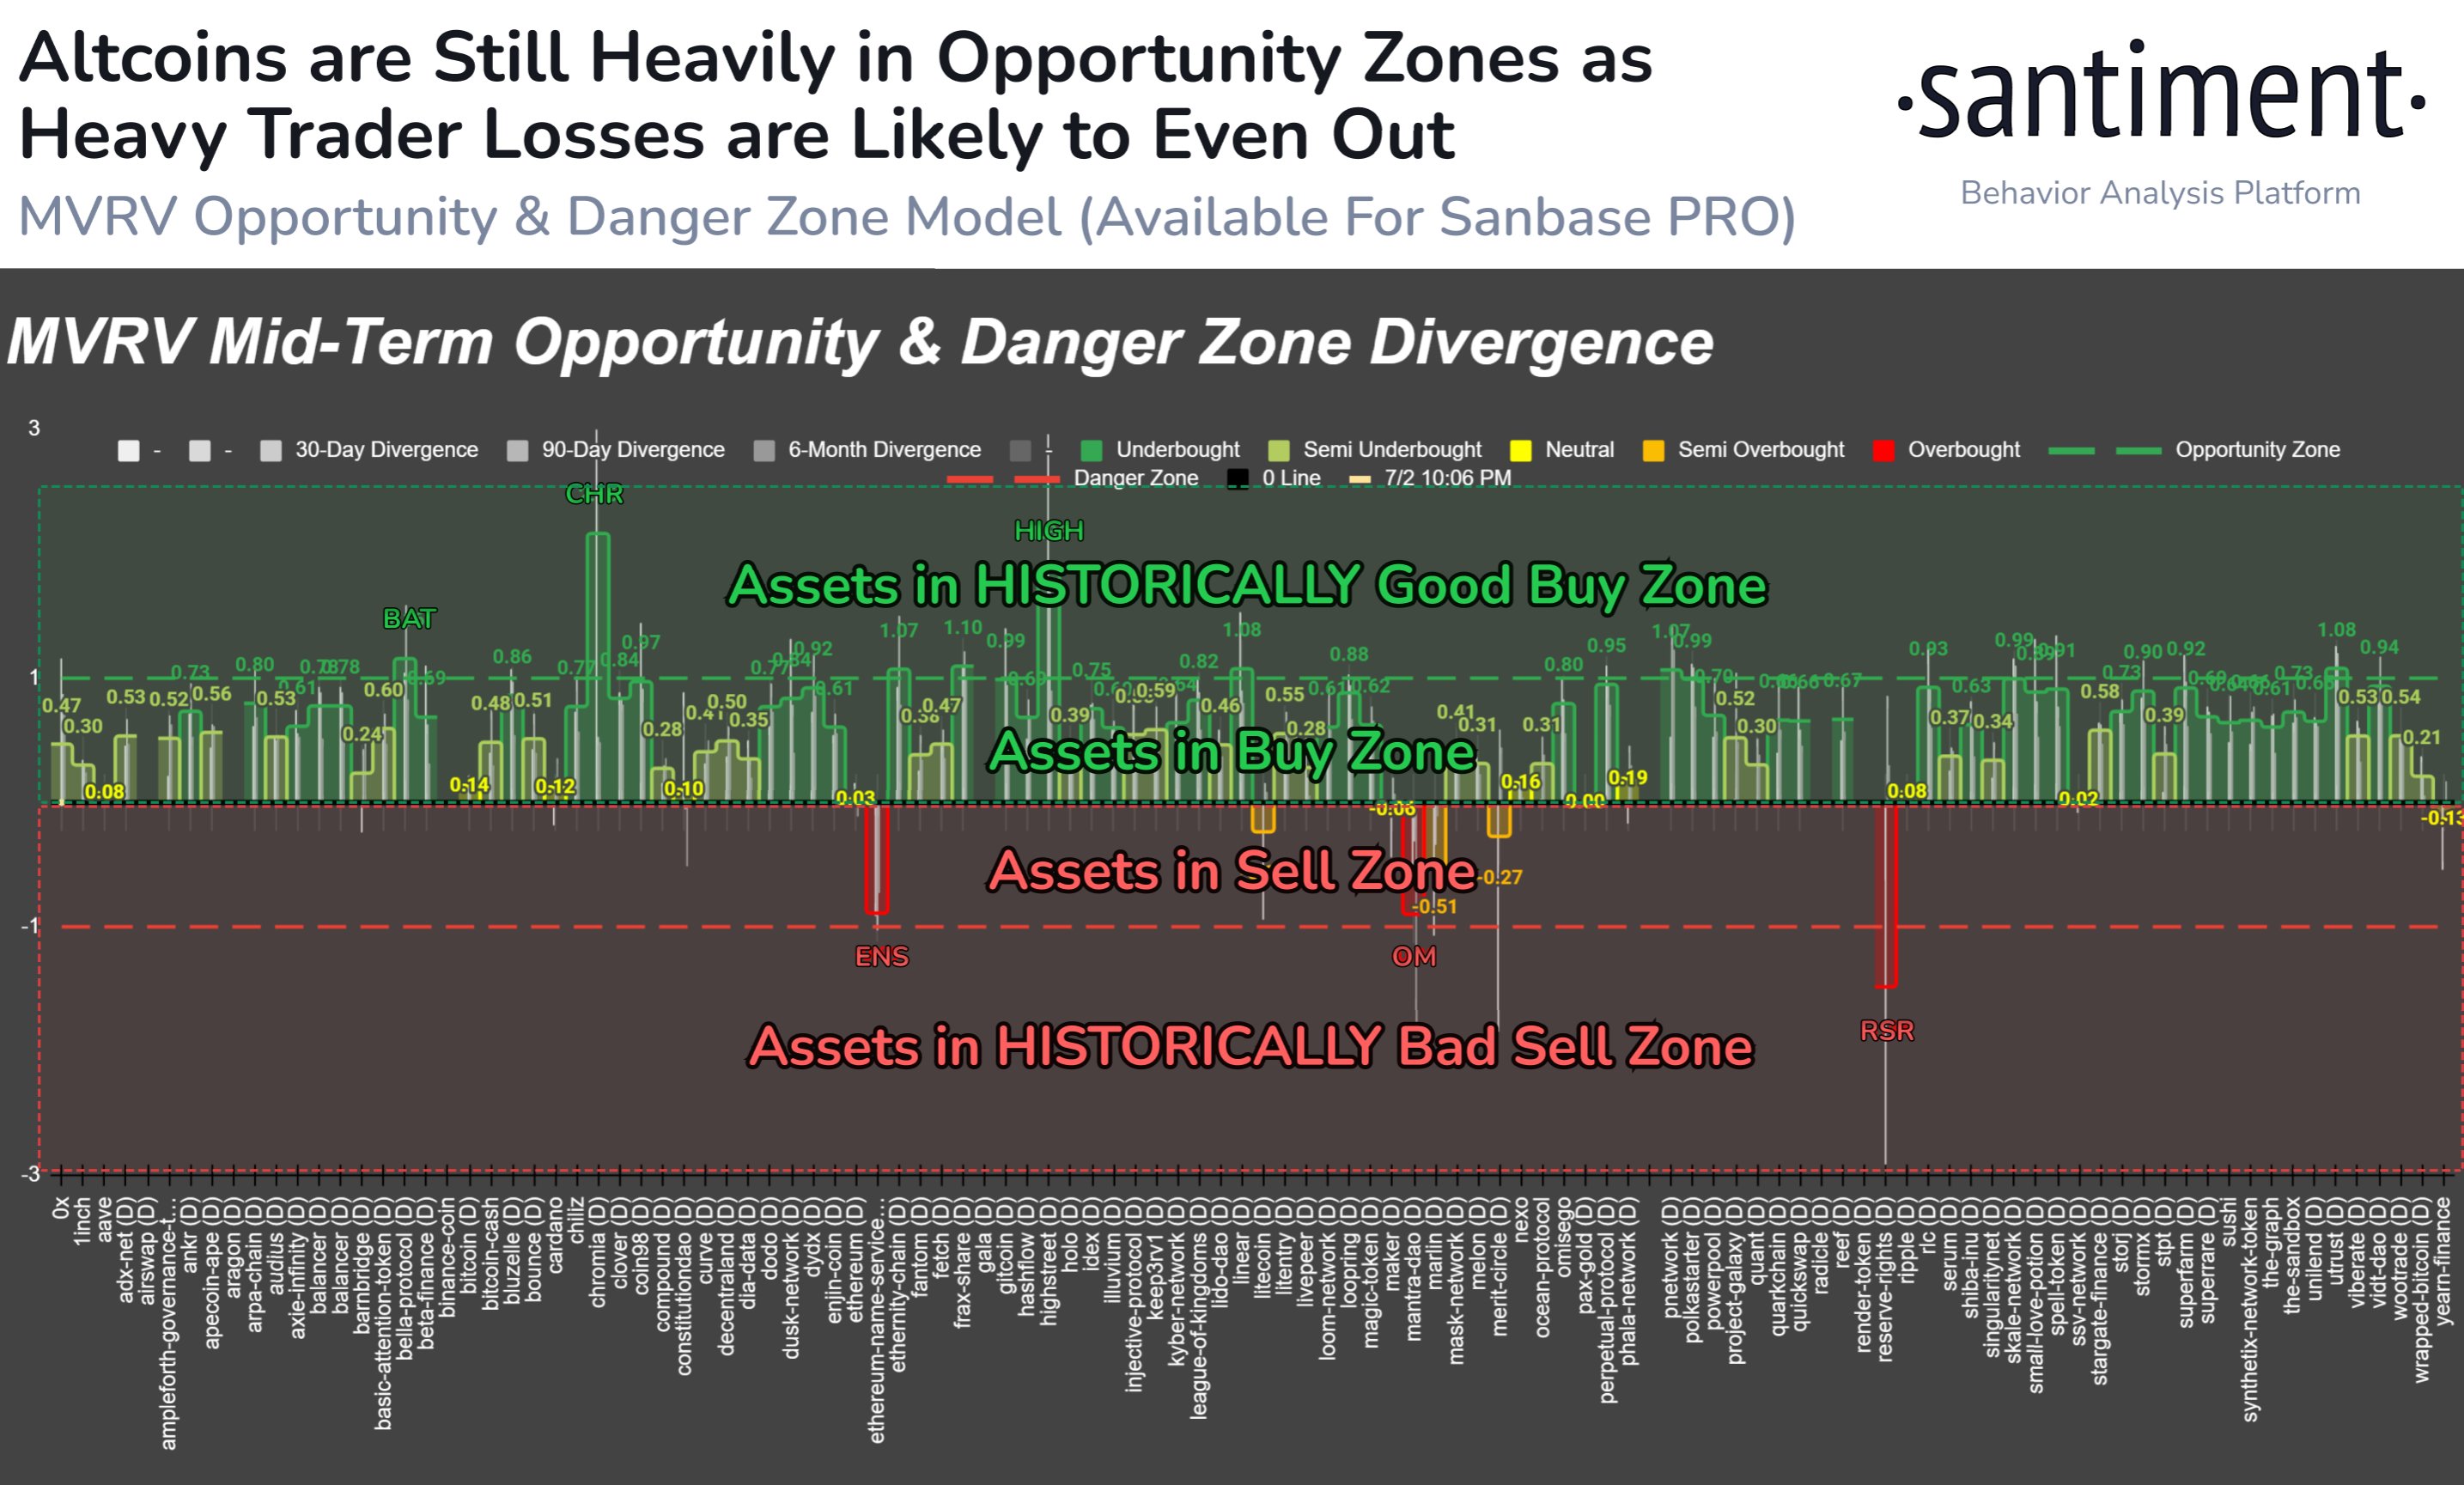
Note that in this model, the zero mark takes the role of the neutral 1 level from the MVRV ratio. Also, the polarity is flipped here, with values under zero implying profit dominance and those above signifying loss.
The graph shows that most of the altcoins are in the positive region right now, suggesting that their investors are underwater. Among these, Basic Attention Token (BAT), Chromia (CHR), and Highstreet (HIGH) particularly stand out as their MVRV divergence exceeds the 1 mark.
Under this model, the region above 1 is called the “Opportunity Zone,” as assets have historically offered the most profitable opportunities while inside it.
While most altcoins are at least slightly undervalued currently, a few, like Ethereum Name Service (ENS), MANTRA (OM), and Reserve Rights (RSR), are in or near the Danger Zone instead. The Danger Zone, which occurs under -1, is the counterpart to the Opportunity Zone, where coins become overvalued.
Ethereum Price
Ethereum, the largest among the altcoins, has faced a plunge of more than 4% in the last 24 hours, which has taken its price under the $3,300 level.
Recommended Articles


