


Ripple transaction volume jumps closer to $4 billion, what does this mean for XRP?
- Ripple transaction volume climbed to $3.96 billion on Monday, and retail traders capitulated, according to Santiment data.
- On-chain metrics paint a bullish picture for XRP recovery amidst the latest developments in the SEC vs. Ripple lawsuit.
- XRP wiped out nearly 1% of its value on Wednesday, technical indicators suggest recovery is likely.
Ripple (XRP) made a comeback above $0.48 on Tuesday and hovers above that level in Wednesday’s European session. Ripple on-chain metrics such as transaction volume and Network Realized Profit/Loss (NPL) have turned bullish, supporting a recovery in the altcoin.
The US Securities and Exchange Commission (SEC) vs. Ripple lawsuit proceeds with the issue of fines for the alleged violation of securities laws. While Ripple proposed $10 million in penalties, the SEC quoted $102.6 million in a filing on May 29.
Daily Digest Market Movers: Ripple traders see signs of recovery in bullish on-chain metrics
- Ripple on-chain metric transaction volume, which tracks the demand for an asset and its relevance among traders, noted a large spike on Monday, as Ripple’s transaction volume climbed to $3.96 billion, according to Santiment data.
- Higher transaction volume is associated with higher activity on the chain and demand for XRP among traders. When combined with the Network Realized Profit/Loss (NPL) metric, transaction volume offers a complete picture, as to whether traders are taking profits or losses and where XRP is headed.
 [13.11.32, 03 Jul, 2024]-638556055100384541.png)
XRP transaction volume vs. price
- The NPL metric shows consistent losses taken by XRP traders, a sign of capitulation. Capitulation is marked by traders shedding their holdings at a loss, and a recovery in the asset’s price typically follows.
- The large negative spikes on NPL represent XRP traders’ realized losses in the past week.
 [13.11.37, 03 Jul, 2024]-638556055414227876.png)
XRP NPL vs. price
- When the two metrics are combined, it is clear that large-volume transactions were associated with traders realizing losses, and this supports the thesis of capitulation for XRP. The altcoin could see a recovery soon if the historical trend repeats.
- The SEC vs. Ripple lawsuit has no new update after the discussion of settlement fees among the two parties.
Technical analysis: XRP eyes comeback to $0.5330 resistance
XRP is trading at $0.4841 on Wednesday. While the altcoin erases nearly 1% of its value on the day, the Moving Average Convergence Divergence (MACD) momentum indicator in the daily chart suggests a recovery in XR/USDT is likely.
The MACD shows green histogram bars above the neutral line, and the MACD line crosses above the signal line, supporting a bullish thesis for XRP.
XRP could rally towards the Fair Value Gap between $0.5008 and $0.5164, as seen in the chart below. The next resistance for Ripple is $0.5330.
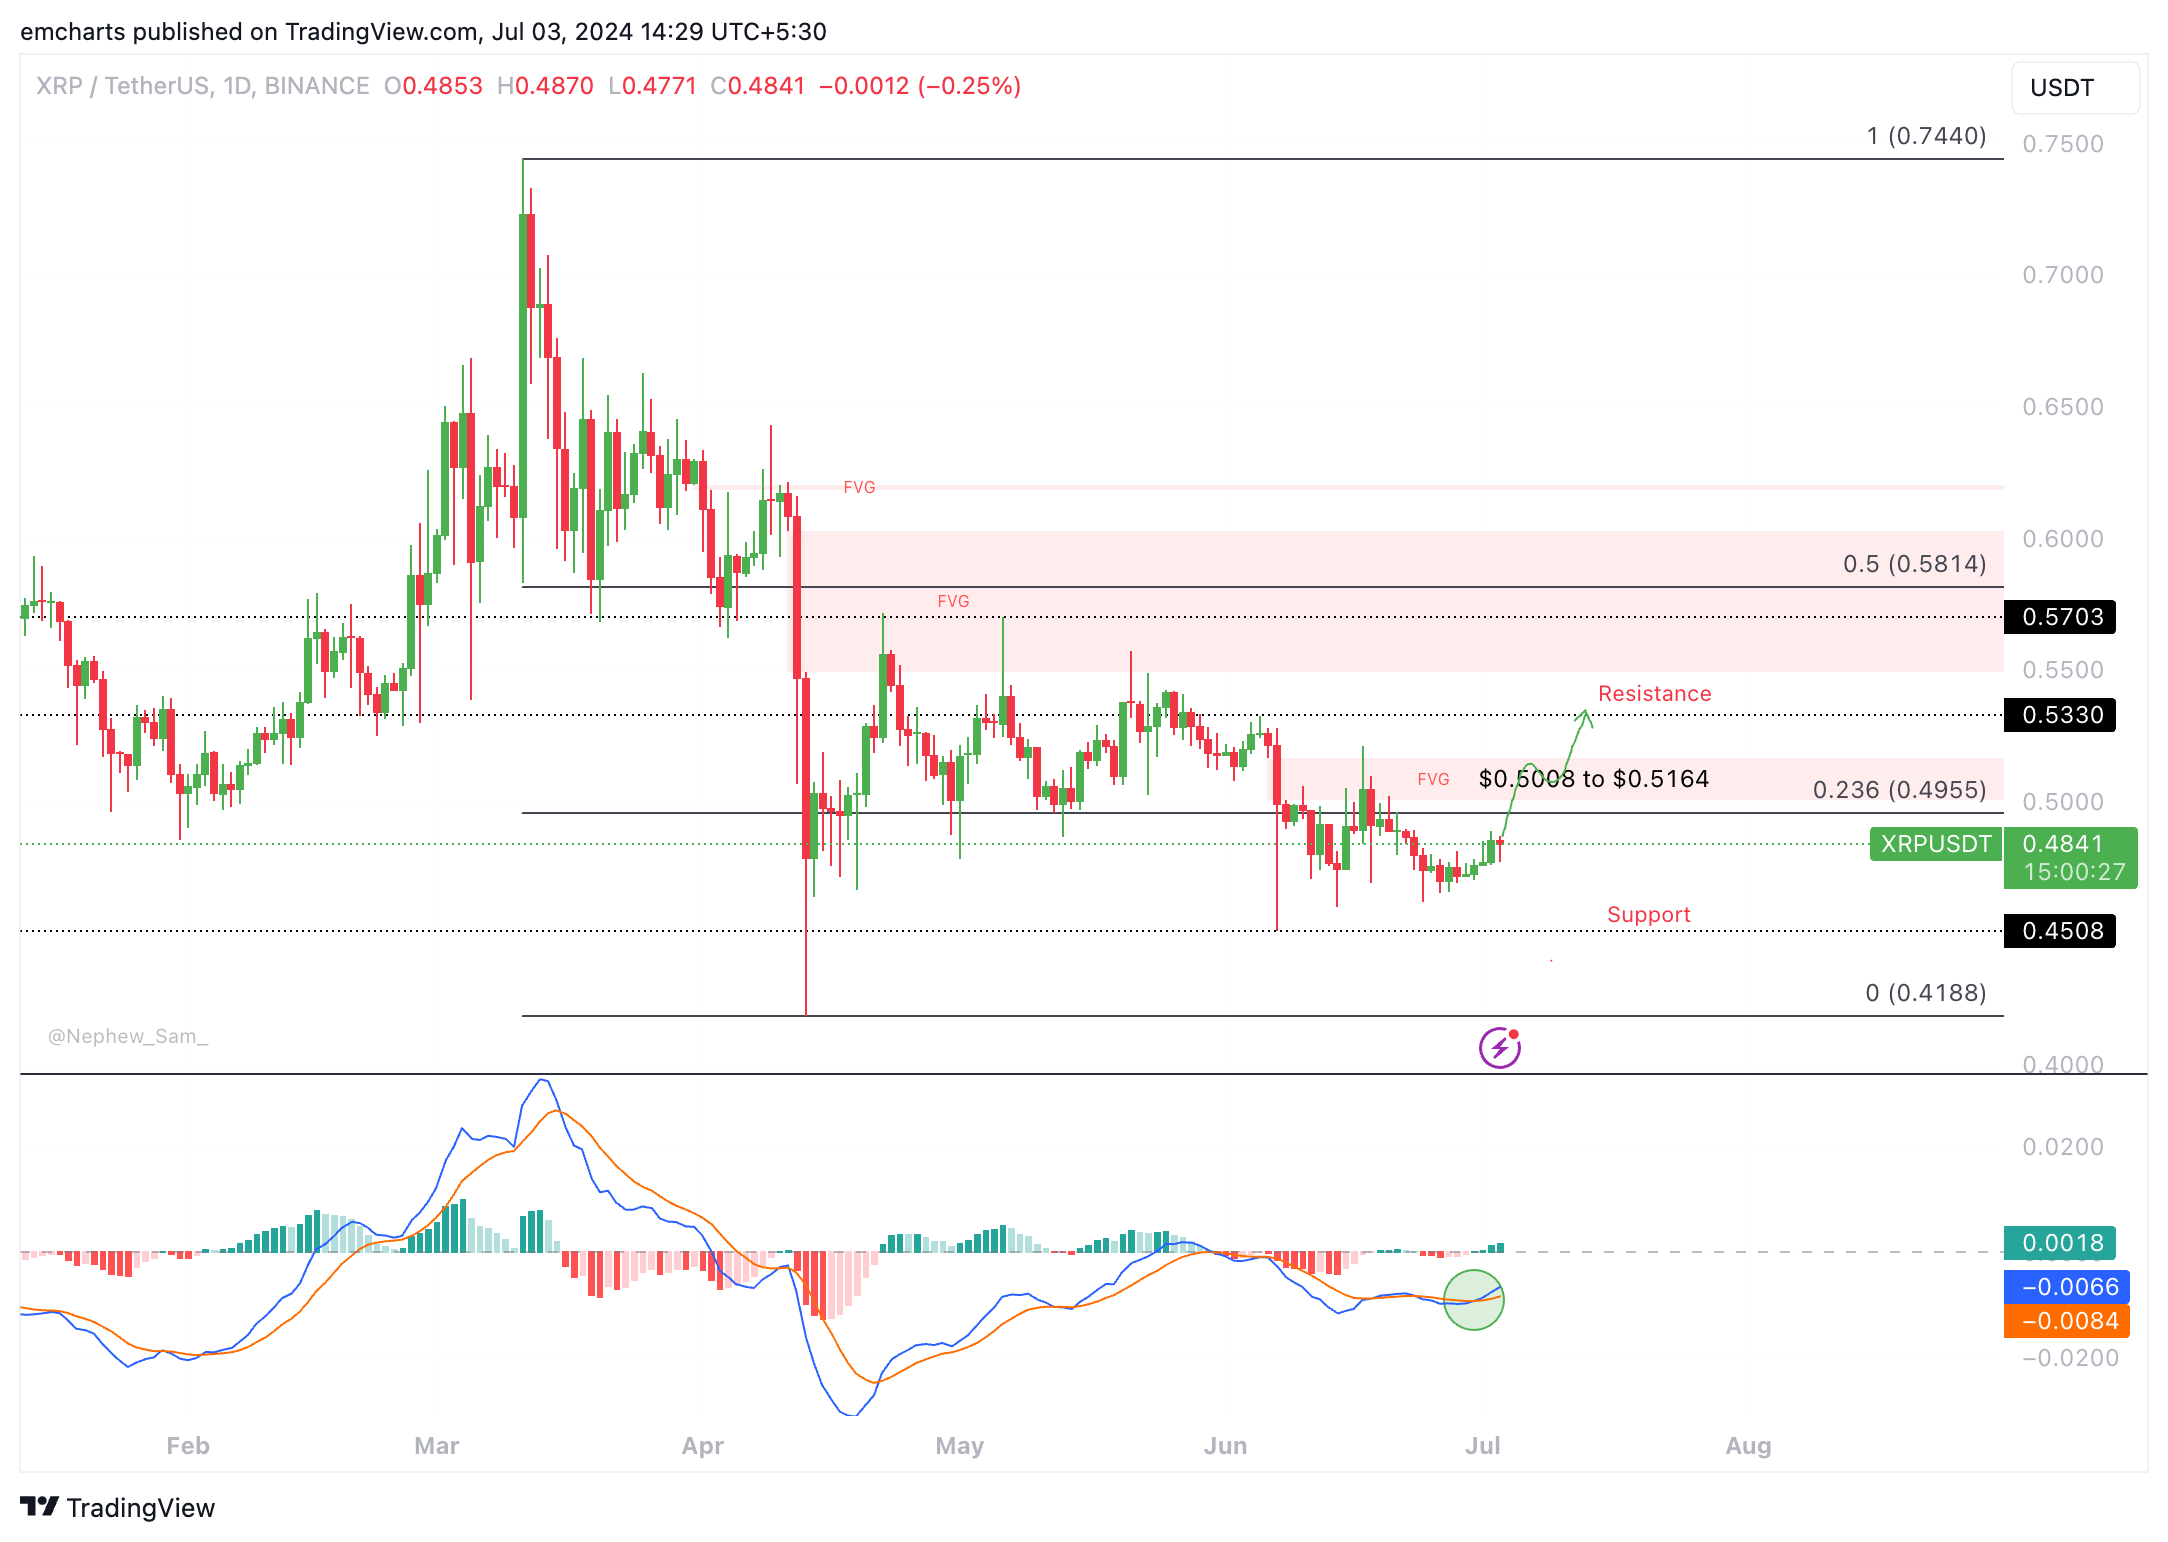
XRP/USDT daily chart
On the contrary, if XRP suffers a correction, Ripple could find support at $0.4508, the June 7 low. Further support is the April 13 low of $0.4188.
Bitcoin, altcoins, stablecoins FAQs
Bitcoin is the largest cryptocurrency by market capitalization, a virtual currency designed to serve as money. This form of payment cannot be controlled by any one person, group, or entity, which eliminates the need for third-party participation during financial transactions.
Altcoins are any cryptocurrency apart from Bitcoin, but some also regard Ethereum as a non-altcoin because it is from these two cryptocurrencies that forking happens. If this is true, then Litecoin is the first altcoin, forked from the Bitcoin protocol and, therefore, an “improved” version of it.
Stablecoins are cryptocurrencies designed to have a stable price, with their value backed by a reserve of the asset it represents. To achieve this, the value of any one stablecoin is pegged to a commodity or financial instrument, such as the US Dollar (USD), with its supply regulated by an algorithm or demand. The main goal of stablecoins is to provide an on/off-ramp for investors willing to trade and invest in cryptocurrencies. Stablecoins also allow investors to store value since cryptocurrencies, in general, are subject to volatility.
Bitcoin dominance is the ratio of Bitcoin's market capitalization to the total market capitalization of all cryptocurrencies combined. It provides a clear picture of Bitcoin’s interest among investors. A high BTC dominance typically happens before and during a bull run, in which investors resort to investing in relatively stable and high market capitalization cryptocurrency like Bitcoin. A drop in BTC dominance usually means that investors are moving their capital and/or profits to altcoins in a quest for higher returns, which usually triggers an explosion of altcoin rallies.
Recommended Articles


