


Crypto Analyst Says Next Bitcoin Target Is $78,700 If BTC Breaks This Resistance
An analyst explained that the next target for Bitcoin could be $78,700 if BTC could cross this resistance level of an on-chain pricing model.
Bitcoin MVRV Extreme Deviation Pricing Bands Put Resistance At $65,800
In a new post on X, analyst Ali has discussed some price levels for Bitcoin that could be important based on an on-chain pricing model. The model is based on the Market Value to Realized Value (MVRV) ratio.
The MVRV ratio is a popular indicator that, in short, keeps track of the ratio between the value the Bitcoin investors are holding right now (the market cap) and what they initially used to purchase their coins (the realized cap). This metric tells us about the profit/loss situation of the market as a whole.
Now, a pricing model called the MVRV Extreme Deviation Pricing Bands uses standard deviations from the all-time mean of the MVRV ratio to determine significant price levels for the cryptocurrency.
Below is the chart shared by the analyst that shows how the levels relevant to this model have looked recently.
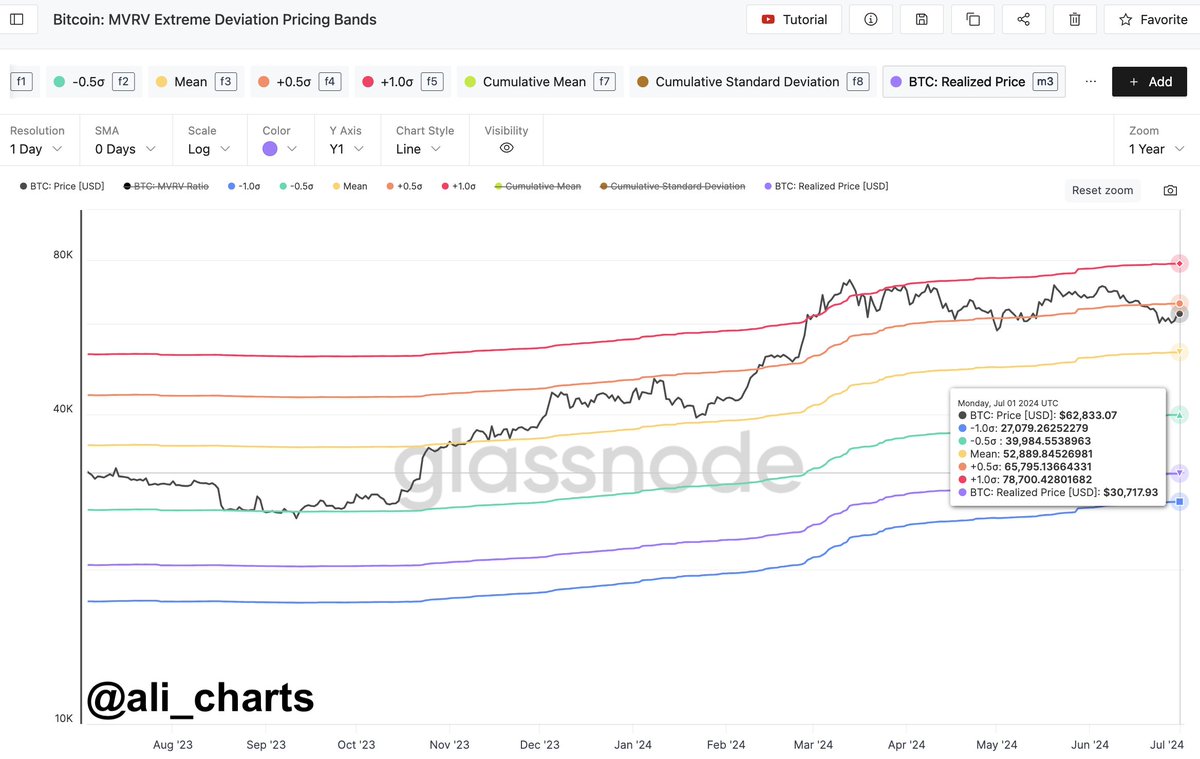
The chart’s yellow line in the middle represents the price level at which the MVRV ratio would become equal to its all-time mean. At present, this level is equal to around $52,900.
The level above this line, colored in orange, corresponds to 0.5 standard deviation (SD) above the indicator’s mean. Currently, the cryptocurrency’s spot price is under this mark, implying that the MVRV ratio’s deviation is smaller than 0.5 SD.
Ali notes that this level, corresponding to 0.5 SD, at about $65,800, is “one of the most crucial resistance areas” for Bitcoin. The graph shows that Bitcoin struggled to break above this level during retests in December 2023 and January 2024.
The analyst says that if BTC can break past this resistance, the $78,700 mark, corresponding to 1 SD from the MVRV ratio mean, could be the next significant target.
Historically, tops in the asset have become more probable to form when the MVRV ratio has deviated above this line. The all-time high (ATH) price earlier in the year, which continues to be the rally’s peak, also occurred soon after the asset rose above this level.
From the current spot price of Bitcoin, a surge towards this potential target of $78,700 would suggest an increase of more than 27% for the cryptocurrency. Before the asset could dream of retesting this level, it would need to break past the $65,800 resistance.
BTC Price
Bitcoin surged past the $63,800 level yesterday but has seen a setback in the past 24 hours, as its price has now dropped to $61,800.
Recommended Articles


