
Render price set for 34% rally after breaking above $7.86 resistance level
- Render price retested its weekly support around $7.01, bounced 9.5%, and is currently down 0.36% at $7.66.
- On-chain data shows that RNDR capitulation event occurred on June 28.
- A weekly candlestick close below $7.01 would invalidate the bullish thesis.
Render (RNDR) price retested the weekly support level at $7.01, rebounding 9.5% last week. It currently stands at $7.66, with a slight decrease of 0.36% on Monday. On-chain data indicates a capitulation event for RNDR on June 28, accompanied by a decrease in supply on exchanges, suggesting potential for a rally in the coming days.
RNDR shows potential for upside rally amid supply decrease
Render price retested the weekly support level at $7.01 and bounced 9.5% last week. It faces resistance around the next weekly resistance level at $7.96 and trades down 0.36% on the day at $7.66.
Additionally, the weekly support at the $7.01 level roughly coincides with ascending trendline support drawn from joining multiple swing low levels from early November 2023 to late June 2024.
If this support level holds and RNDR closes above $7.96, it could rally 34% to revisit its next weekly resistance level at $10.83.
The Relative Strength Index (RSI) has briefly slipped below the 50 mean level, while the Awesome Oscillator (AO) is on its way to doing the same. If bulls are indeed making a comeback, then both momentum indicators must maintain their positions above their respective mean levels. Such a development would add a tailwind to the recovery rally.
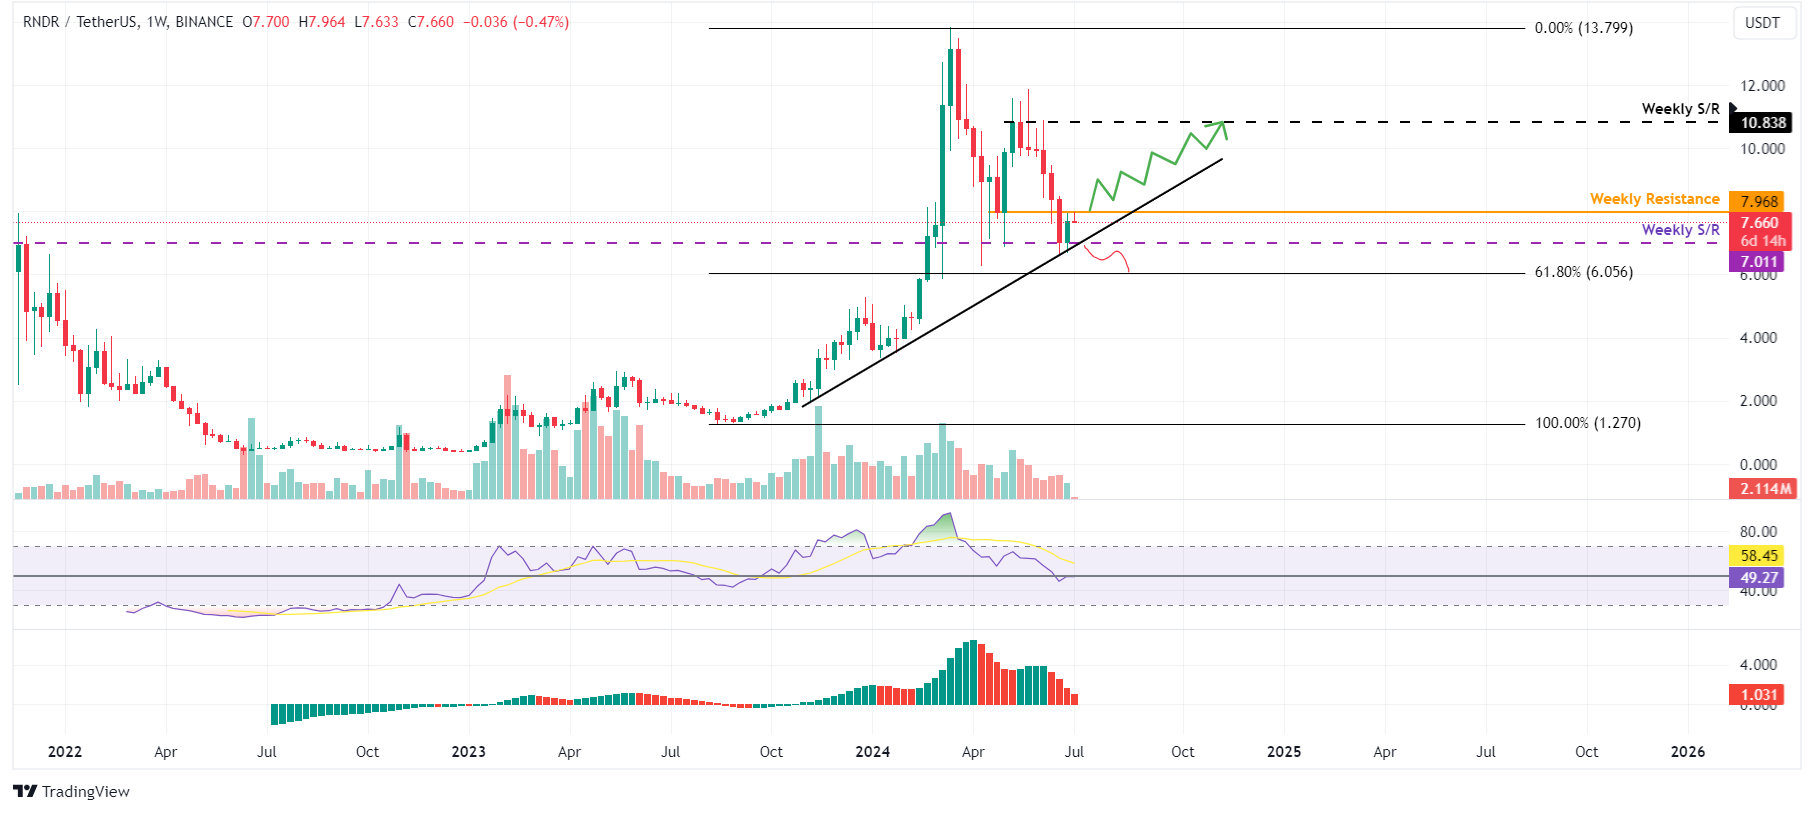
RNDR/USDT weekly chart
Based on IntoTheBlock's In/Out of the Money Around Price (IOMAP), nearly 3,410 addresses accumulated 21.76 million RNDR tokens at an average price of $7.63. These addresses bought the AI-based token between $7.48 and $7.70, which makes it a key support zone. These investors will likely add more to their holdings if the price retraces.
Interestingly, the IOMAP findings coincide with the technical analysis, making the $7.48 to $7.70 zone a key reversal area to watch.
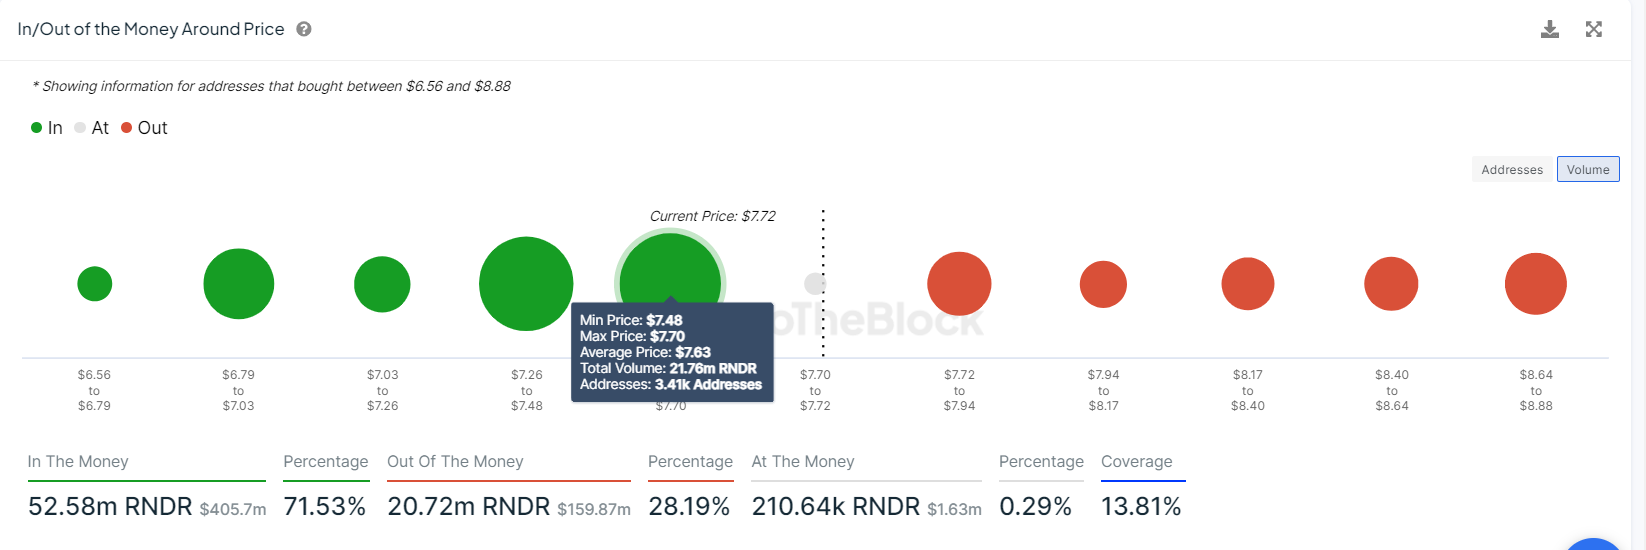
RNDR IOMAP chart
On-chain data provider Santiment’s Network Realized Profit/Loss (NPL) indicator computes a daily network-level Return On Investment (ROI) based on the coin’s on-chain transaction volume. Simply put, it is used to measure market pain. Strong spikes in a coin’s NPL indicate that its holders are, on average, selling their bags at a significant profit. On the other hand, strong dips imply that the coin’s holders are, on average, realizing losses, suggesting panic sell-offs and investor capitulation.
In RNDR’s case, the NPL indicator dipped -49,257 and -23.16 million on June 27 and 28,
coinciding with a 4.6 % price decline. This negative downtick indicates that the holders were, on average, realizing losses.
During this capitulation event, the RNDR’s supply on exchanges declined from 34.46 million to 34.43 million in two days. This decrease in supply on exchanges indicates that the investors are moving RNDR tokens to wallets and reducing selling activity.
 [13.53.58, 01 Jul, 2024]-638554380779096752.png)
RNDR Network Realized Profit/Loss and Supply on Exchanges chart
Even though on-chain metrics and technical analysis point to a bullish outlook, if RNDR's price makes a weekly candlestick close below $7.01, the bullish thesis would be invalidated by creating a lower low on the weekly chart. This development could see Render's price crash by 14% to retest its 61.8% Fibonacci retracement level at $6.05.
Recommended Articles


