
Bitcoin Weekly Forecast: BTC price correction could end in July, according to seasonal data
- US spot Bitcoin ETFs registered slight outflows this week.
- On-chain data shows that miners’ selling activity is increasing, signaling bearish momentum.
- US and German governments collectively transferred to exchanges 4,690.28 BTC, valued at $287.57 million.
- Seasonal data shows that BTC could see gains in July.
Bitcoin (BTC) price appears poised for a decline this week, influenced by slight outflows in US spot ETFs, selling activity among BTC miners, and a combined transfer of 4,690.28 BTC to centralized exchanges by the US and German governments. Technical indicators hint that BTC may undergo a further 5% correction in the near term before potentially continuing its upward trajectory.
Bitcoin miners selling pressure increases
Bitcoin miners have sent their BTC to the exchanges at an average daily rate of 8,592.14 BTC during this week, 29% more than last week, according to the Bitcoin Miner to Exchange Flow data reported by CryptoQuant.
This transfer of funds to exchanges could respond to the immediate need to cover the cost or to gain excess gains by selling at the price BTC miners consider to be overvalued. Both cases are correlated to sell action, which naturally leads to interpreting this reason as a price drop, which indicates a bearish sign for Bitcoin.
 - All Miners, All Exchanges (1)-638551677032942856.png)
Bitcoin Miner to Exchange Flow (Total) chart
Major government BTC transfers spark FUD
Data from Arkham Intelligence shows that the US Government transferred 3,940.28 BTC, valued at $241.22 million, to Coinbase Prime Deposit on Wednesday. This Bitcoin was initially seized from narcotics trafficker Banmeet Singh and forfeited during a trial in January 2024.
Additionally, this week, data from Lookonchain shows that the German government executed a transfer of 750 BTC, valued at $46.35 million. In a separate transaction, a smaller transfer of 0.001 BTC to Flow Traders indicates a potential test transaction or a preliminary step toward BTC sale through that entity.
Over the past week, German authorities have transferred 2,100 BTC, equivalent to $135.22 million, to platforms such as Coinbase, Bitstamp, and Kraken. Currently, the German government holds 45,609 BTC, valued at $2.81 billion.
This sudden movement of funds by the US and German authorities could have sparked FUD (Fear, Uncertainty, Doubt) among traders, potentially influencing Bitcoin’s 2.5% price decline this week.
Update: US Government Sends $240M BTC to Coinbase Prime
— Arkham (@ArkhamIntel) June 26, 2024
The US Government just moved 3,940 BTC ($240M) to Coinbase Prime.
This BTC was originally seized from narcotics trafficker Banmeet Singh, and forfeited at trial in January 2024.
Transaction: https://t.co/hZ1CwqWCmF pic.twitter.com/9t6k8Wdizq
The German Government transferred 750 $BTC($46.35M) out again, of which 250 $BTC($15.41M) was transferred to #Bitstamp and #Kraken.
— Lookonchain (@lookonchain) June 26, 2024
German Government currently holds 45,609 $BTC($2.81B).
The German Government also transferred 0.001 $BTC to Flow Traders, which may be a test… pic.twitter.com/F0CFUDPQoP
Bitcoin spot ETFs display weakness
US spot Bitcoin ETFs have seen outflows persist for three consecutive weeks, according to Coinglass data, starting with a $174.5 million outflow on Monday. This was followed by a modest inflow totaling $63.8 million over the next three days. Despite this inflow, the overall net outflow by Thursday amounted to $110.7 million. This reduction hints at a minor waning of investor confidence, potentially foreshadowing a temporary dip in Bitcoin’s price, as ETF Net Inflow data is essential for gauging investor sentiment and market dynamics in Bitcoin ETFs.
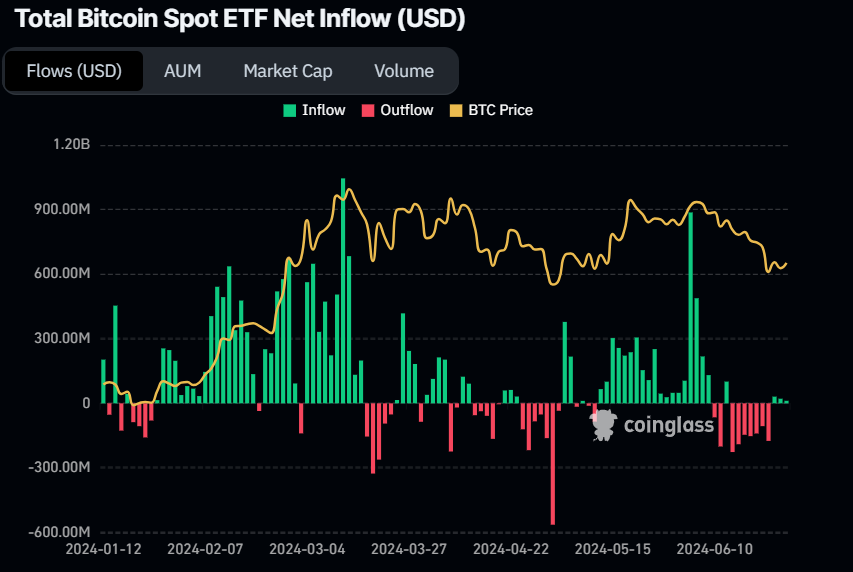
Total Bitcoin Spot ETF Net Inflow (USD) chart
Bitcoin could have double-digit gains in July
Bitcoin Monthly returns (%) data, reported by Coinglass, shows historical bounce backs for BTC price in July. Historically, following negative Junes, BTC has rebounded with double-digit gains in July. Over the past five years, periods of post-June drawdowns have often led to BTC rallies of over 9.6%, occasionally reaching as high as 24%.
Tracking monthly returns helps market participants assess trends, evaluate investment strategies, and anticipate potential market movements based on historical performance.
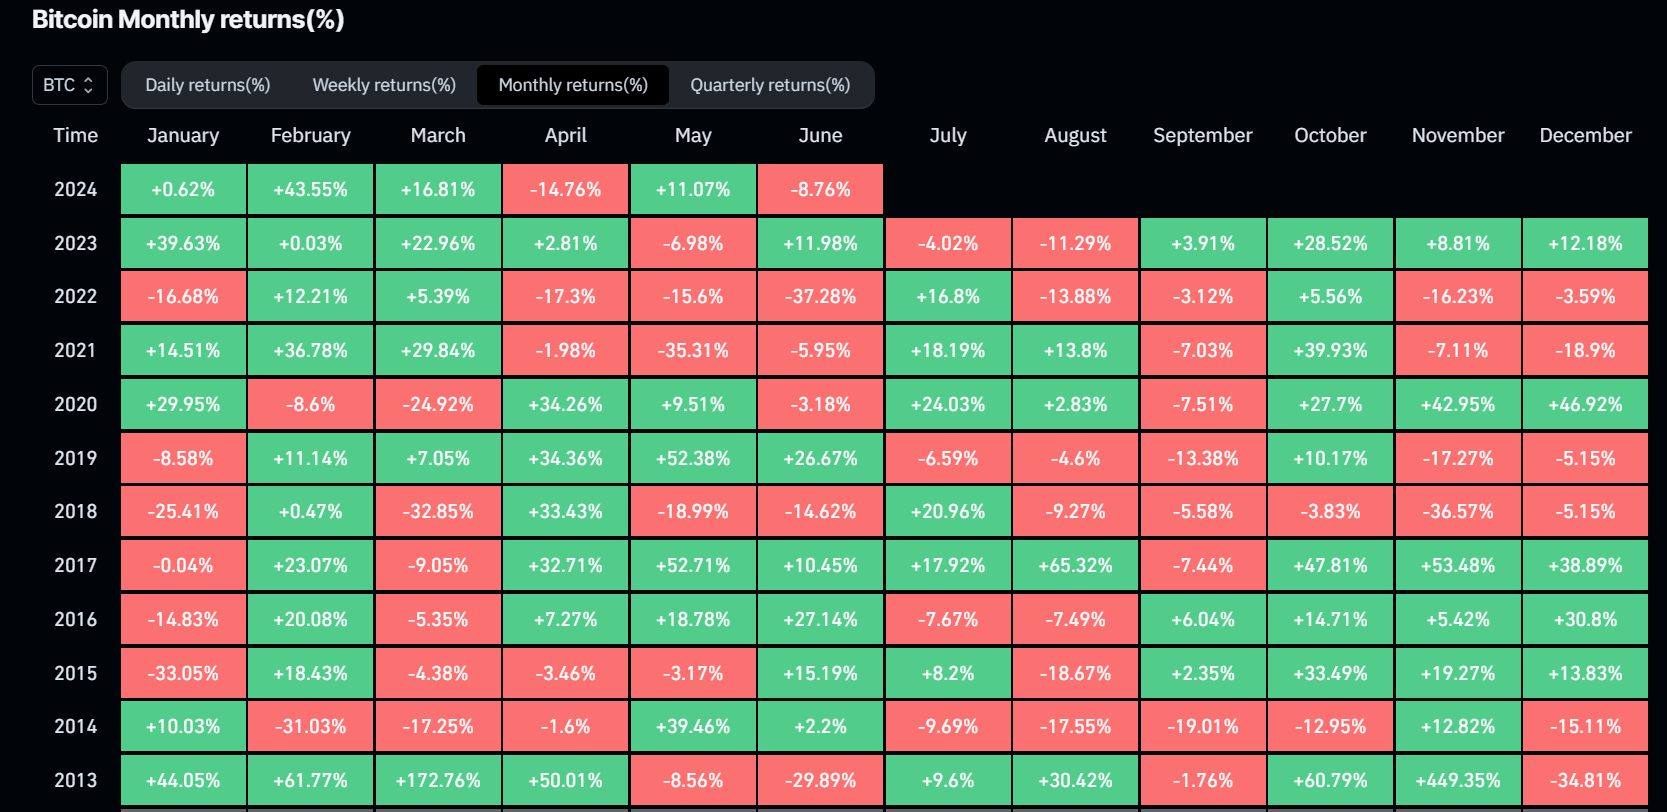
Bitcoin Monthly returns (%) chart
Bitcoin faces resistance at the lower band of the descending wedge
Bitcoin price broke below the descending wedge on Monday, declining approximately 7.5% to retest its crucial weekly support near $58,375 and rebounded by 5.8% on Tuesday.
Since Tuesday, BTC has faced resistance at the lower boundary of the broken descending wedge. At the time of writing, Bitcoin trades around $61,347.
If the lower boundary of the descending wedge around $62,000 holds as resistance, BTC could decline roughly 5% to reach its weekly support near $58,375.
On the daily chart, the Relative Strength Index (RSI) and the Awesome Oscillator (AO) are below their respective neutral levels of 50 and zero. This indicates that, according to these momentum indicators, the bearish sentiment prevails, suggesting the potential for further decline in BTC’s price.
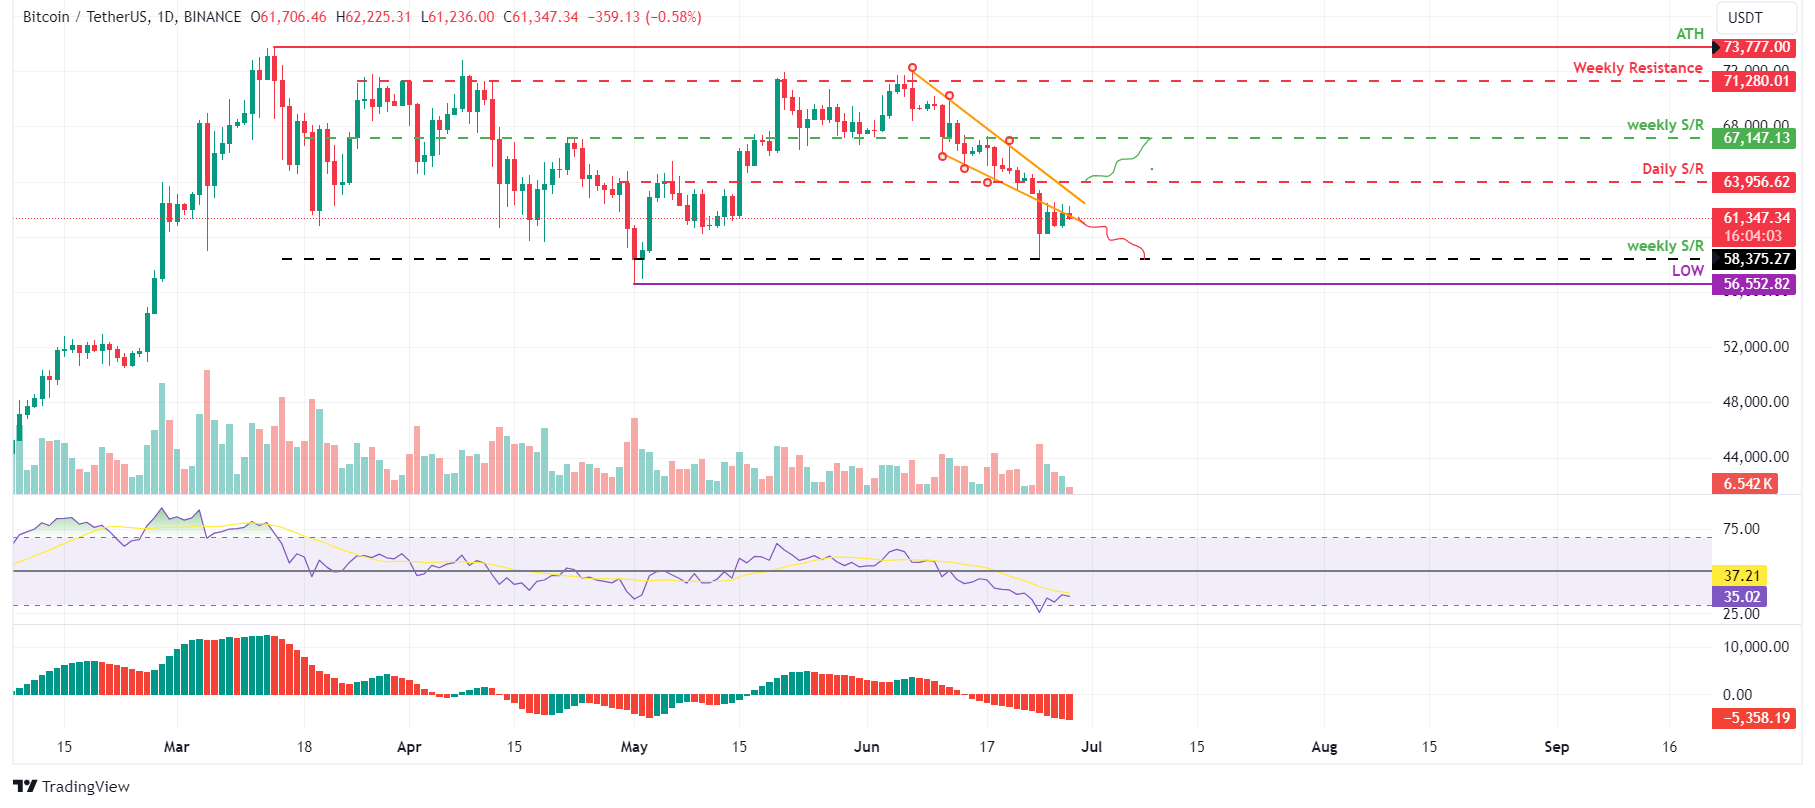
BTC/USDT daily chart
However, if BTC closes above the $63,956 level and forms a higher high in the daily time frame, it could indicate that bullish sentiment persists. Such a development may trigger a 5% rise in Bitcoin’s price, revisiting its next weekly resistance at $67,147.
Recommended Articles


