BNB Price Forecast: Poised for an 11% crash
- Binance Coin price closed below the ascending trendline support on Sunday, signaling a bearish move.
- BNB finds support around the $560 level, the daily low from May 15.
- A daily candlestick close above $635.4 would invalidate the bearish thesis.
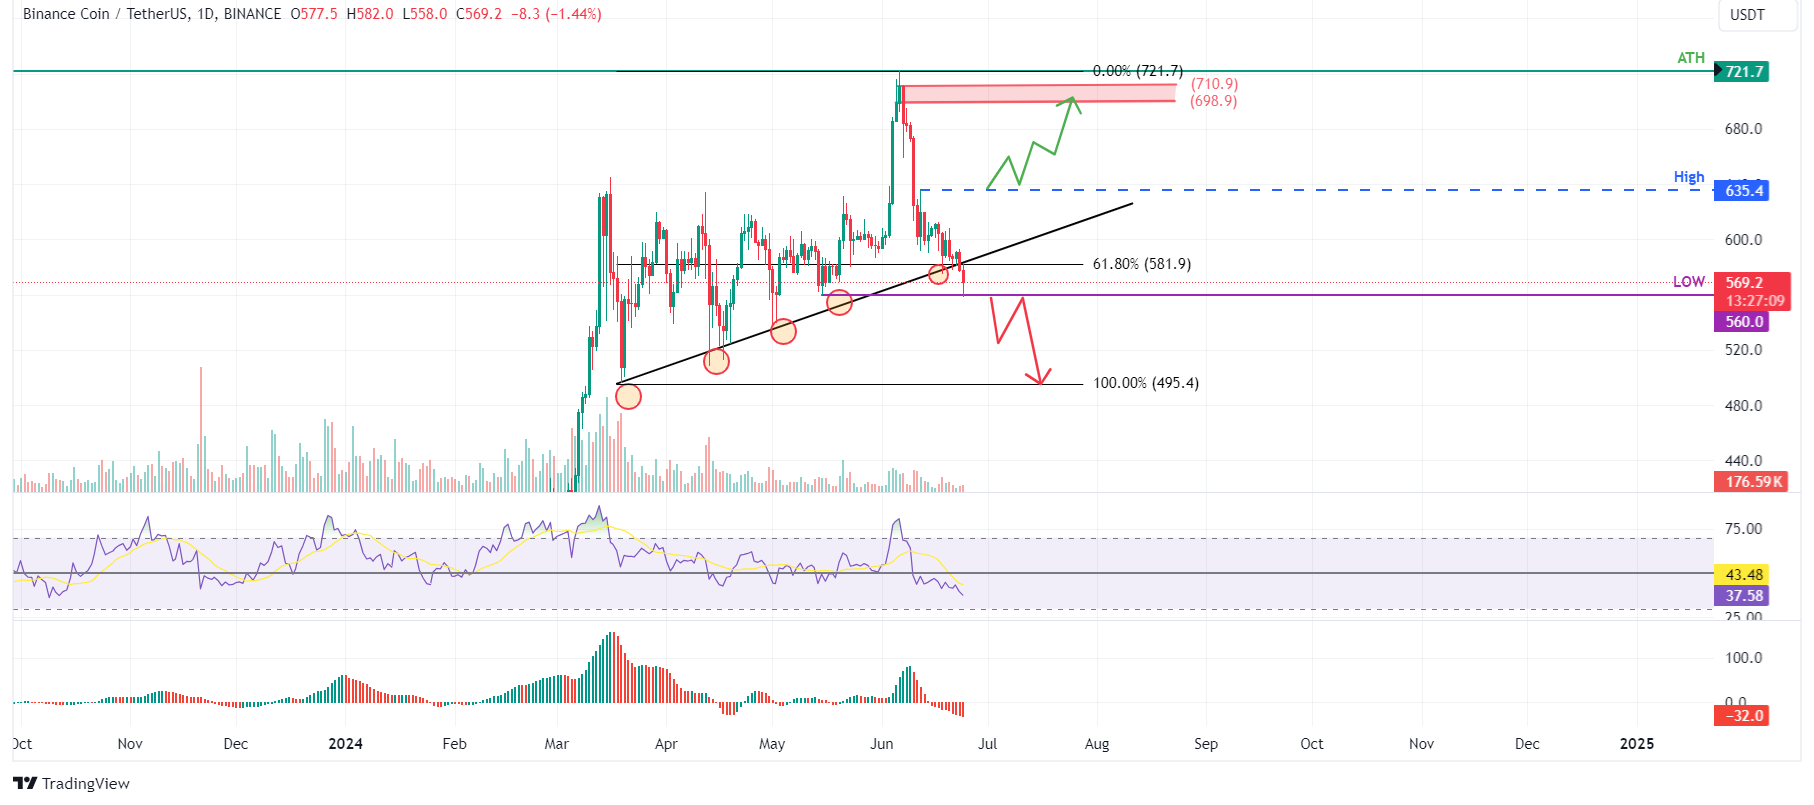
Binance Coin (BNB) price broke below the ascending trendline support on Sunday, signaling a bearish move. Currently, BNB finds support around the $560 level, matching the May 15 daily low. This price action suggests that BNB could experience an 11% decline in the coming days.
BNB price set for a downward correction
Binance Coin price broke below an ascending trendline on Sunday. This trendline is drawn from joining multiple swing low levels from mid-March to mid-June, as shown in the daily chart below.
If this trendline holds as pullback resistance and the BNB daily candlestick closes below the $560 low from May 15, Binance Coin price could crash 11% to retest its previous support at the March 19 low of $495.4.
The Relative Strength Index (RSI) and the Awesome Oscillator (AO) indicators on the daily chart support this bearish thesis, as both are below their respective mean levels of 50 and zero. This suggests continued momentum favoring bears, potentially leading to a further decline in the BNB’s price.

BNB/USDT 1-day chart
However, if BNB's daily candlestick closes above $635.4 and establishes a higher high on the daily timeframe, it may signal a shift in market dynamics that favors bullish sentiment. Such a change could nullify the bearish outlook, leading to an additional 10% rally in the BNB’s price to retest its previous resistance at $698.9.

