Uniswap Price Forecast: UNI could be poised for 30% rally after month-long lull

Source Fxstreet
  • Uniswap price breaks out of the 35-day consolidation price zone, signaling a potential upward move.
  • On-chain data shows tokens from dormant wallets are moving again.
  • A daily candlestick close below $6.76 invalidates the bullish thesis.

Uniswap (UNI) price has broken out of a 35-day consolidation this week, a sign of a possible rally ahead that could increase the token’s price around 30%. Technical indicators support the bullish thesis, while on-chain data also aligns with it.

Uniswap price looks set to reclaim highs

Uniswap price broke the $6.76 to $8.20 consolidation after a 20% rally on May 22. This move also allowed UNI to establish itself above the 200-day Exponential Moving Average (EMA), currently hovering at $8.07. Typically, massive moves tend to revert to the mean, which provides an opportunity for sidelined buyers to accumulate. 

There are three levels to buy UNI dip.

  1. A retest of the 200-day EMA at $8.07, roughly 13% lower than the current price of $9.40.
  2. The daily order block, extending from $7.53 to $7.97, coincides with the 200-day EMA and is the second level to buy UNI.
  3. Investors can also consider securing UNI if it retests the upper limit of the aforementioned range at $8.20. 

Assuming Uniswap price bounces from the $8.20 level, the conservative target is $10.61, which is roughly 30% away. Beyond this, UNI could also retest $12.80 in case of an extremely bullish outlook. This move would constitute a 60% gain. The second target is ambitious and is only likely to occur if the market condition is extremely bullish.

Supporting this bullish thesis, the Relative Strength Index (RSI) and the Awesome Oscillator (AO), both of which, have breached their mean levels of 50 and 0, indicating that the bulls are in control.
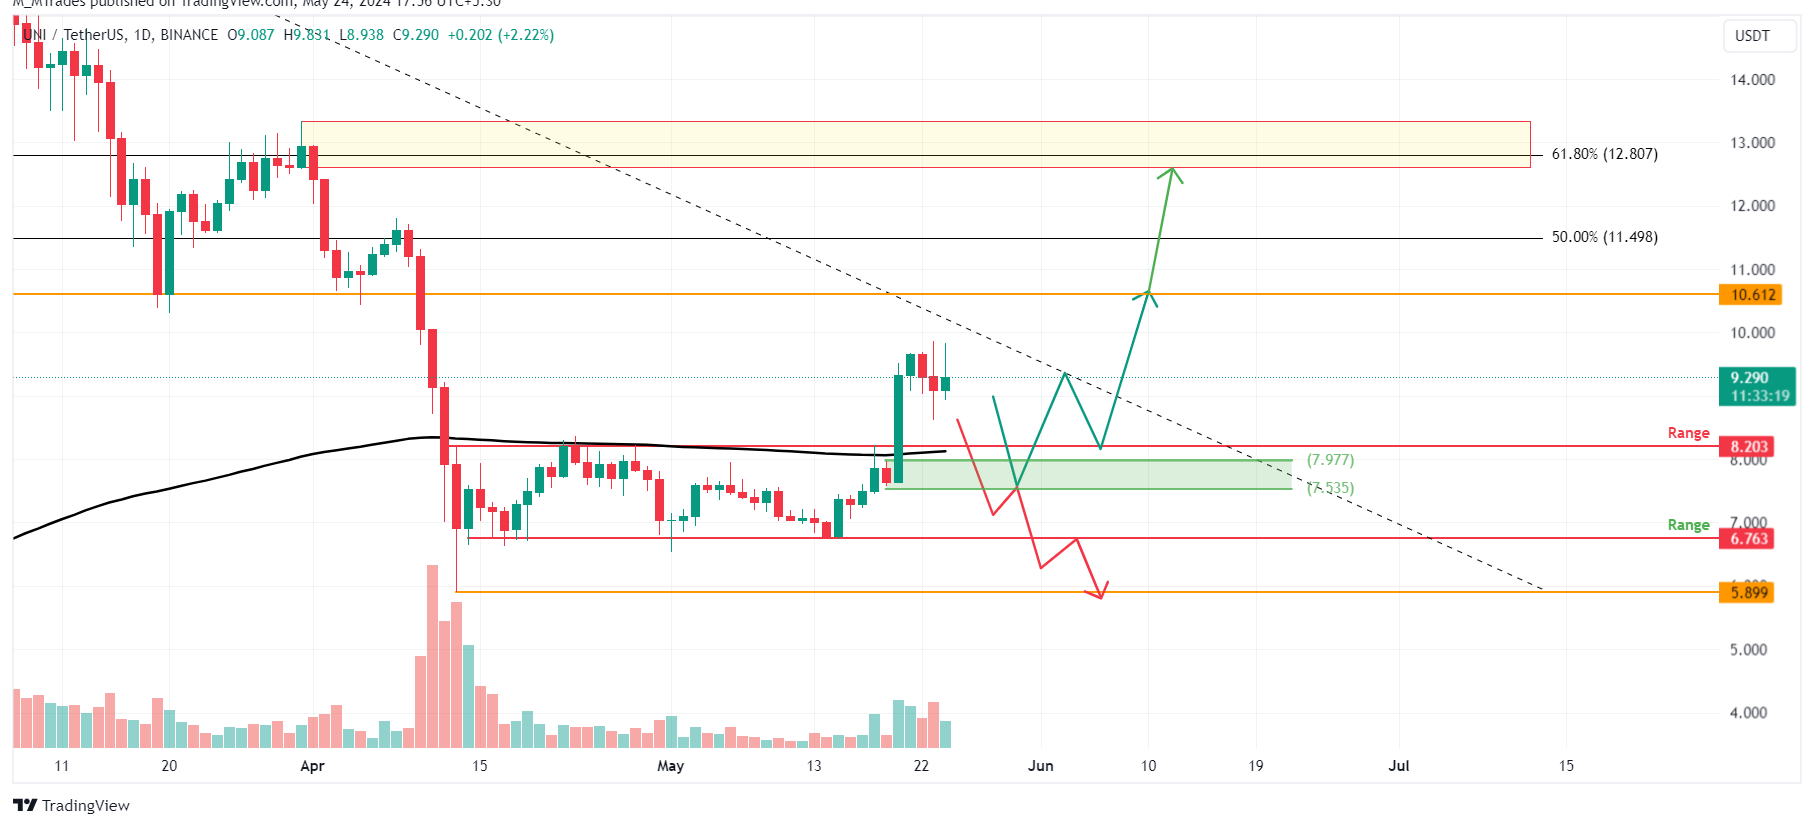
UNI/USDT 1-day chart

UNI/USDT 1-day chart

Santiment’s Age Consumed index is in line with the bullish outlook noted from a technical perspective. The spikes in this index suggest dormant tokens (tokens stored in wallets for a long time) are in motion and can be used to spot short-term local tops or bottoms.

For UNI, history shows that the spikes were followed by a rally in Uniswap price. The most recent uptick on April 25 also forecasted that UNI was ready for an uptrend.

UNI Age Consumed chart

UNI Age Consumed chart

Regardless of promising technical analysis and on-chain data, if the daily candlestick closes below the $6.76 price level, a lower low would be formed. This scenario would flip the bullish market structure to bearish, which could cause the UNI price to crash 13% to $5.89.

Disclaimer: For information purposes only. Past performance is not indicative of future results.
placeholder
Gold Price Forecast: XAU/USD declines below $4,050 on USD strength and hawkish Fed comments Gold price (XAU/USD) extends the decline to around $4,030 during the early Asian session on Tuesday. The precious metal edges lower as traders dialed back expectations of a US interest rate cut next month.
Author  FXStreet
Nov 18, Tue
Gold price (XAU/USD) extends the decline to around $4,030 during the early Asian session on Tuesday. The precious metal edges lower as traders dialed back expectations of a US interest rate cut next month.
placeholder
Bitcoin Volatility Spikes: Is Options-Driven Pricing Making a Comeback?Bitcoin's volatility is surging, suggesting a shift back to options-driven price action seen before Bitcoin ETFs were launched.
Author  Mitrade
Nov 24, Mon
Bitcoin's volatility is surging, suggesting a shift back to options-driven price action seen before Bitcoin ETFs were launched.
placeholder
2025 Black Friday is coming! Which stocks may see volatility?Coming on the day right after Thanksgiving in the United States, Back Friday marks the start of the holiday shopping season. Sales data from this shopping frenzy day reflects investor confidence and consumer trends. The National Retail Federation (NRF) predicts that holiday season (Nov and Dec) retail sales in 2025 will likely exceed $1 trillion for the very first time, which represents a year-over-year increase of 3.7 to 4.2 percent. Historic data from the past decade show that the retail sector has generally outperformed the S&P 500 during the weeks before and after Black Friday. The following retailing companies are expected to be big winners:
Author  Insights
Nov 24, Mon
Coming on the day right after Thanksgiving in the United States, Back Friday marks the start of the holiday shopping season. Sales data from this shopping frenzy day reflects investor confidence and consumer trends. The National Retail Federation (NRF) predicts that holiday season (Nov and Dec) retail sales in 2025 will likely exceed $1 trillion for the very first time, which represents a year-over-year increase of 3.7 to 4.2 percent. Historic data from the past decade show that the retail sector has generally outperformed the S&P 500 during the weeks before and after Black Friday. The following retailing companies are expected to be big winners:
placeholder
Bitcoin Bleeds to $86K, But This Key Indicator Screams "The Top Isn't In"Bitcoin’s adjusted Spent Output Profit Ratio (aSOPR) has spent nearly two years coiling below the extremes seen at past bull-market peaks, even as BTC trades around $86,300 and down 9% on the week — a setup that leaves open the possibility that this cycle’s true top may still lie ahead.
Author  Mitrade
Nov 25, Tue
Bitcoin’s adjusted Spent Output Profit Ratio (aSOPR) has spent nearly two years coiling below the extremes seen at past bull-market peaks, even as BTC trades around $86,300 and down 9% on the week — a setup that leaves open the possibility that this cycle’s true top may still lie ahead.
placeholder
Bitcoin Price Rebound Gains Traction with $90K Break in SightBitcoin is trading above $87,000 and its 100-hour SMA after rebounding from $83,500, with a bearish trend line at $88,200 and resistance at $89,000–$90,000 now in focus as BTC either breaks higher toward $91,750–$94,000 or slips back toward $86,700, $85,000 and lower supports.
Author  Mitrade
Yesterday 02: 58
Bitcoin is trading above $87,000 and its 100-hour SMA after rebounding from $83,500, with a bearish trend line at $88,200 and resistance at $89,000–$90,000 now in focus as BTC either breaks higher toward $91,750–$94,000 or slips back toward $86,700, $85,000 and lower supports.
goTop
quote