

Litecoin price could kickstart a 32% ascent if LTC bulls overcome this crucial level

Source Fxstreet
  • Litecoin price hovers below the $100 psychological level and a declining resistance level. 
  • Due to the bullish market structure, LTC could kickstart an ascent to $119.84. 
  • A breakdown of the $76.78 support level will invalidate the bullish thesis.

Litecoin (LTC) price shows strength as it attempts to recover last week’s losses. LTC faces two critical hurdles, overcoming which could result in massive gains for the altcoin. 

Also read: Why Litecoin active addresses spike is not a bullish sign

Litecoin price ready to shatter key levels

Litecoin price has produced three lower highs since March 2022 and currently, hovers below the trend line connecting these swing points. LTC also trades below the $100 psychological, making these two barriers very significant.

The Relative Strength Index (RSI)  and Awesome Oscillator (AO) momentum indicators are both above their respective mean levels of 50 and 0, respectively, suggesting a buyer-dominated market. 

Therefore, if Litecoin price sustains its bullish momentum and overcomes the confluence resistance level at $100, it could signal sidelined buyers to step in and potentially kickstart a breakout rally. The weekly ceiling at $119.84 will be the target for some of these buyers to potentially book profits. 

This move in Litecoin price would constitute a 32% ascent from the current position. 
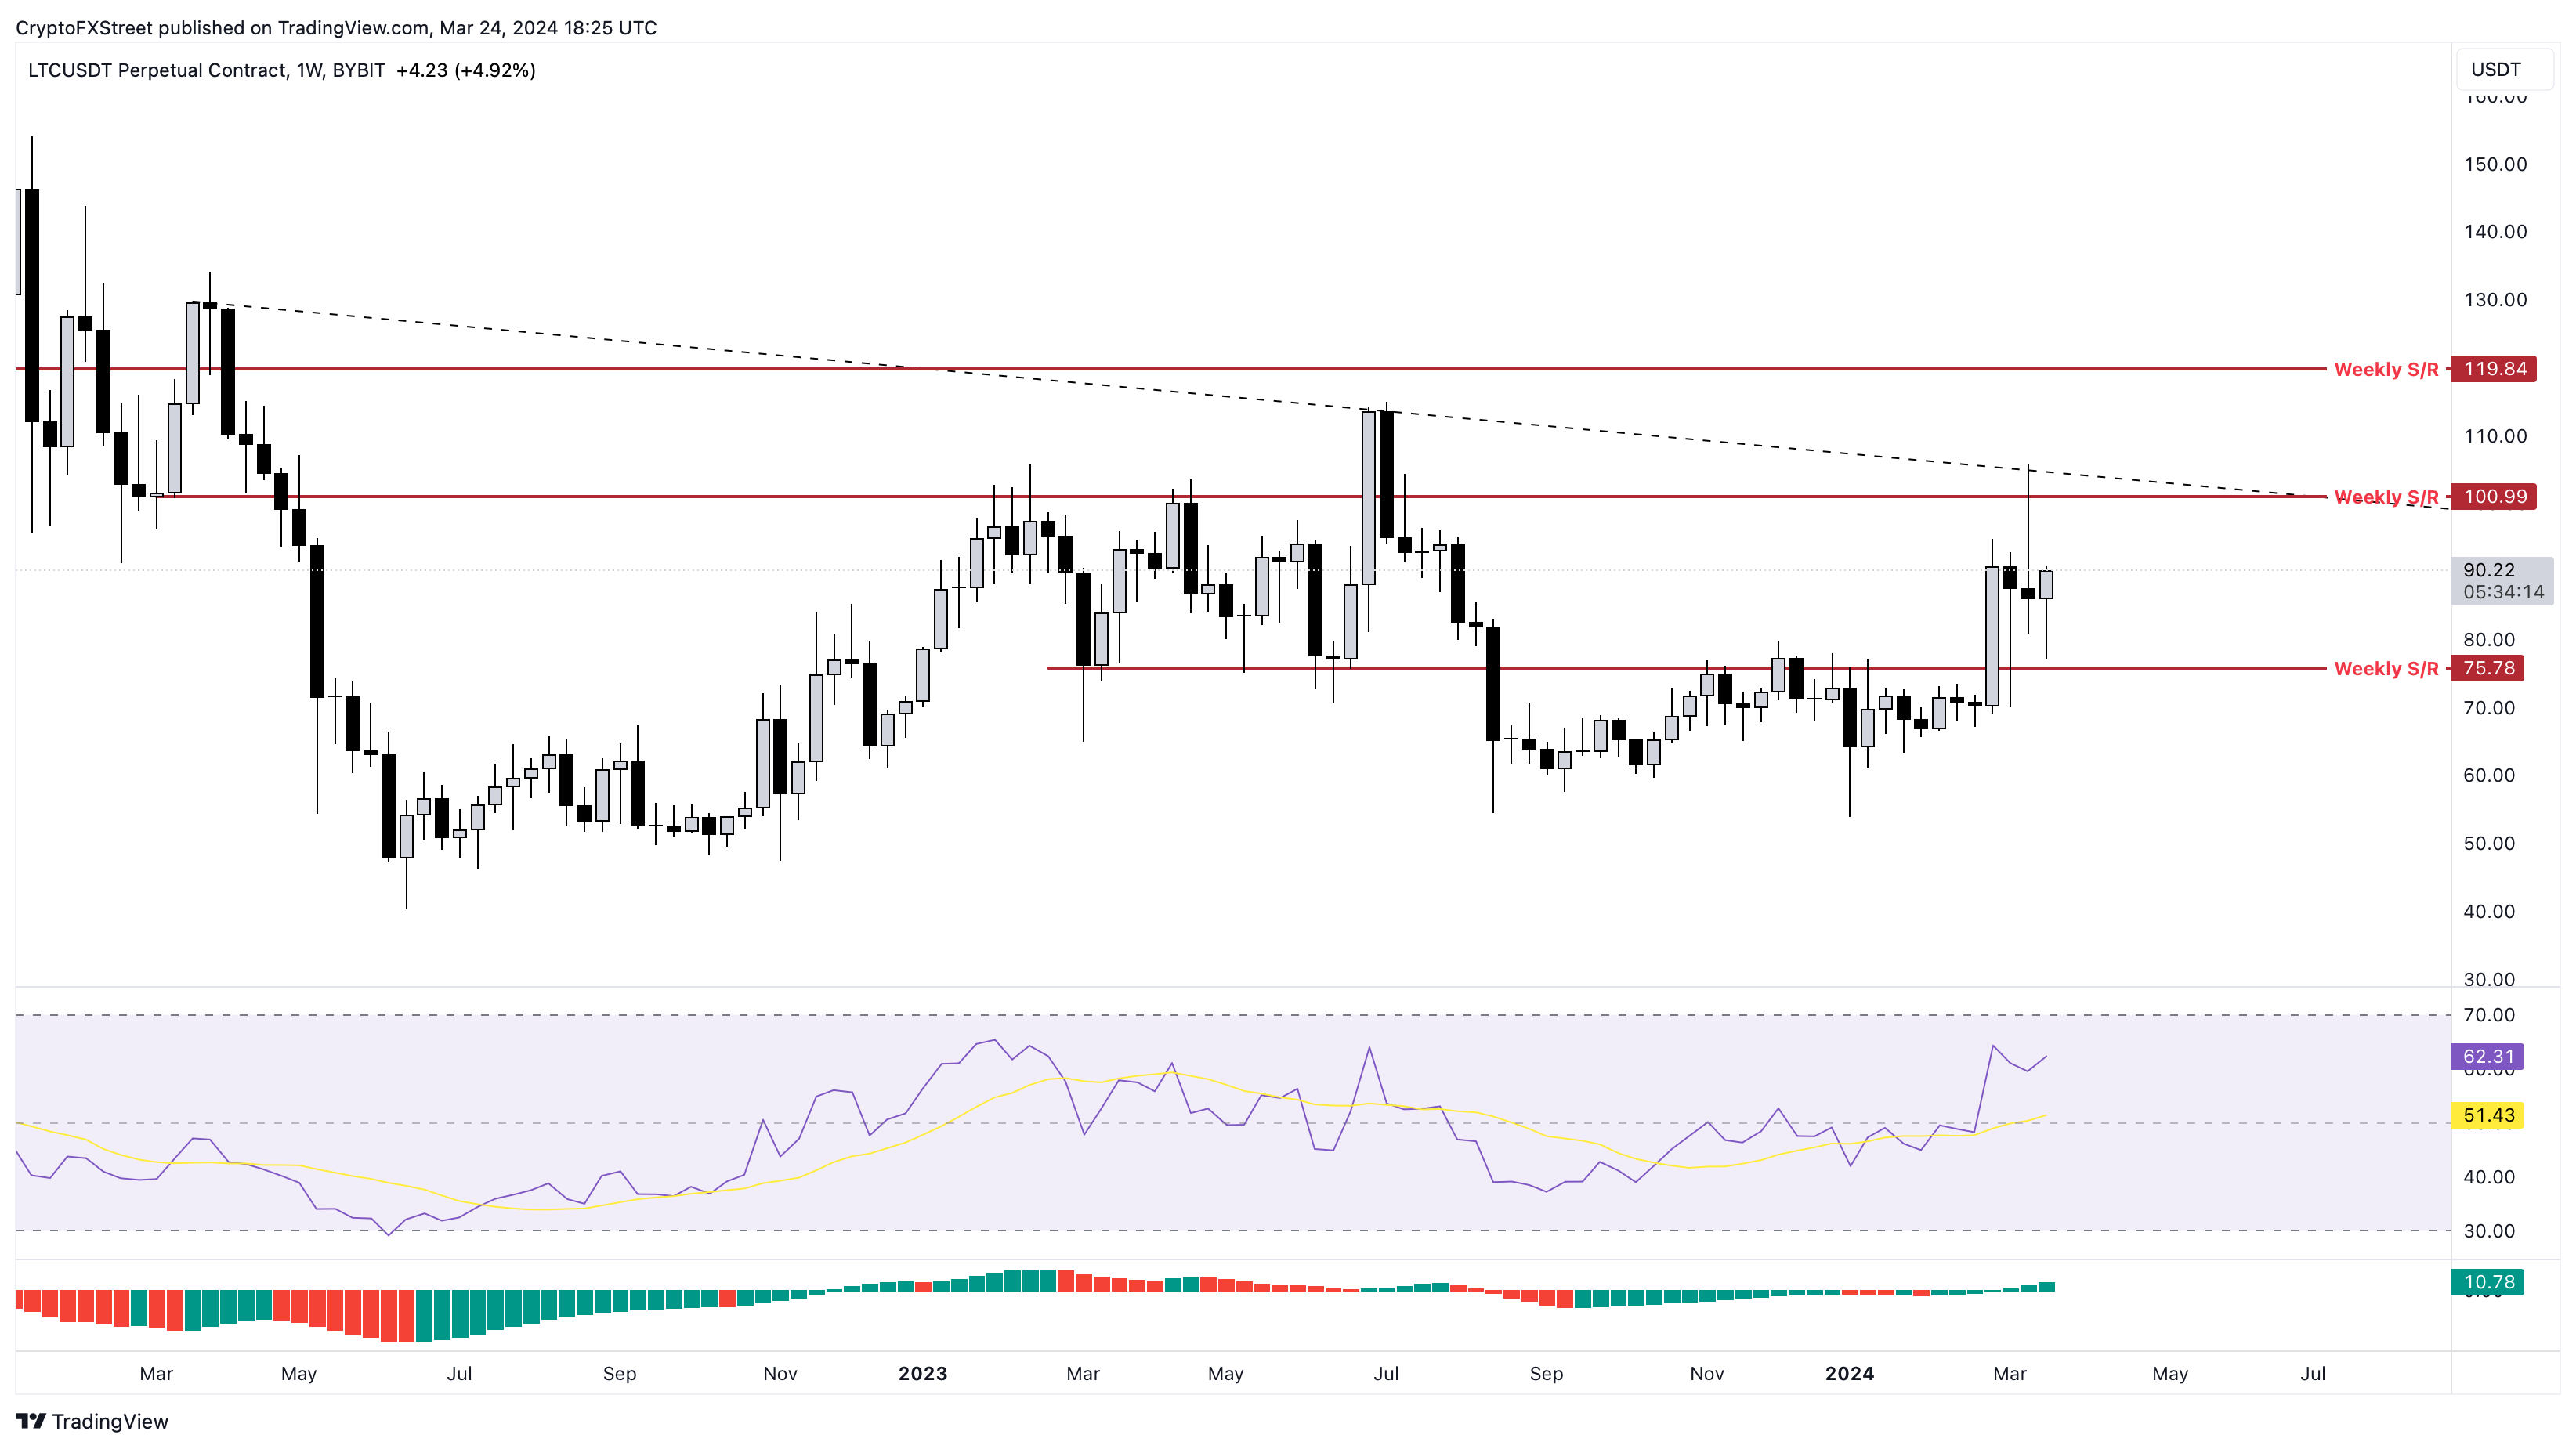
LTC/USDT 1-week chart

LTC/USDT 1-week chart

On the contrary, Litecoin’s bullish outlook could face invalidation if the pioneer crypto – Bitcoin triggers a steep correction. In such a case. Litecoin price could revisit the $75.78 support floor.

A breakdown of this level will create a lower low and invalidate the bullish thesis. Such a development could see LTC potentially tag $53.83, which is nearly 30% lower form $75.78.

Also read: Diverging paths of Monero and Litecoin as Bitcoin flirts with $50K – Who's in the bubble zone?

Disclaimer: For information purposes only. Past performance is not indicative of future results.
placeholder
WTI (USOIL) Is down 2.03% on Sep 25: Here Is WhyWTI (USOIL) is down 2.03% at Sep 24 22:20(UTC+0), now at $92.517, with a 7-day down of 3.63%.What is driving WTI (USOIL)’s stock price down today?The drop in WTI crude oil prices was primarily driven by
Author  TradingKey
Yesterday 04: 57
WTI (USOIL) is down 2.03% at Sep 24 22:20(UTC+0), now at $92.517, with a 7-day down of 3.63%.What is driving WTI (USOIL)’s stock price down today?The drop in WTI crude oil prices was primarily driven by
placeholder
Silver Price Forecast: XAG/USD remains steady near $64.00 as oil prices easeSilver price (XAG/USD) inches higher after two days of losses, trading around $63.90 per troy ounce during Asian hours on Friday. Non-yielding Silver is finding underlying support as inflation concerns ease following a pullback in crude oil prices.
Author  FXStreet
Yesterday 03: 30
Silver price (XAG/USD) inches higher after two days of losses, trading around $63.90 per troy ounce during Asian hours on Friday. Non-yielding Silver is finding underlying support as inflation concerns ease following a pullback in crude oil prices.
placeholder
Gold Price Forecast: Gold Drops Below $4,300, Will It Continue to Fall? As of the European session on September 24, gold prices (XAUUSD) extended their correction, dipping below $4,300 intraday to hit a low of $4,262.45. After previously rebounding close to $
Author  TradingKey
Sep 24, Thu
As of the European session on September 24, gold prices (XAUUSD) extended their correction, dipping below $4,300 intraday to hit a low of $4,262.45. After previously rebounding close to $
placeholder
Yen touches 158.37 as Tokyo reopens, then slips back — ¥15.4 trillion of intervention and the 200-day line stand between here and 160USD/JPY reached 158.37 overnight, its highest since early September, then eased to 157.88 as Japanese markets reopened after a three-day holiday. The Ministry of Finance has spent ¥15.4 trillion defending the yen since late July and the BOJ ran a rate check on September 18. The 200-day average sits at 158.43.
Author  Irene Q.
Sep 24, Thu
USD/JPY reached 158.37 overnight, its highest since early September, then eased to 157.88 as Japanese markets reopened after a three-day holiday. The Ministry of Finance has spent ¥15.4 trillion defending the yen since late July and the BOJ ran a rate check on September 18. The 200-day average sits at 158.43.
placeholder
US input costs rose at the fastest pace in four years — the September flash PMI beat is an inflation story, not a growth storyUS September flash PMIs came in far above expectations, with the composite at 58.4, a five-year high. But the detail that moved markets was input cost inflation at its fastest since October 2022, driven by fuel, transport and supply shortages. Brent is back above $100 and the 10-year Treasury yield has hit its highest since 2007.
Author  Suzie
Sep 24, Thu
US September flash PMIs came in far above expectations, with the composite at 58.4, a five-year high. But the detail that moved markets was input cost inflation at its fastest since October 2022, driven by fuel, transport and supply shortages. Brent is back above $100 and the 10-year Treasury yield has hit its highest since 2007.
Related Instrument
goTop
quote