
Silver Price Forecast: XAG/USD climbs closer to $34.00, remains below multi-year peak
- Silver regains positive traction following the overnight pullback from a 12-year top.
- A move beyond $34.25-$34.30 is needed to support prospects for additional gains
- Any meaningful dip could attract dip-buyers and remain limited near $32.75-$32.65.
Silver (XAG/USD) attracts some buyers during the Asian session on Thursday and for now, seems to have stalled its corrective slide from the $34.85-$34.90 area, or the highest level since October 2012 touched this week. The white metal currently trades just below the $34.00 round figure, up over 0.50% for the day.
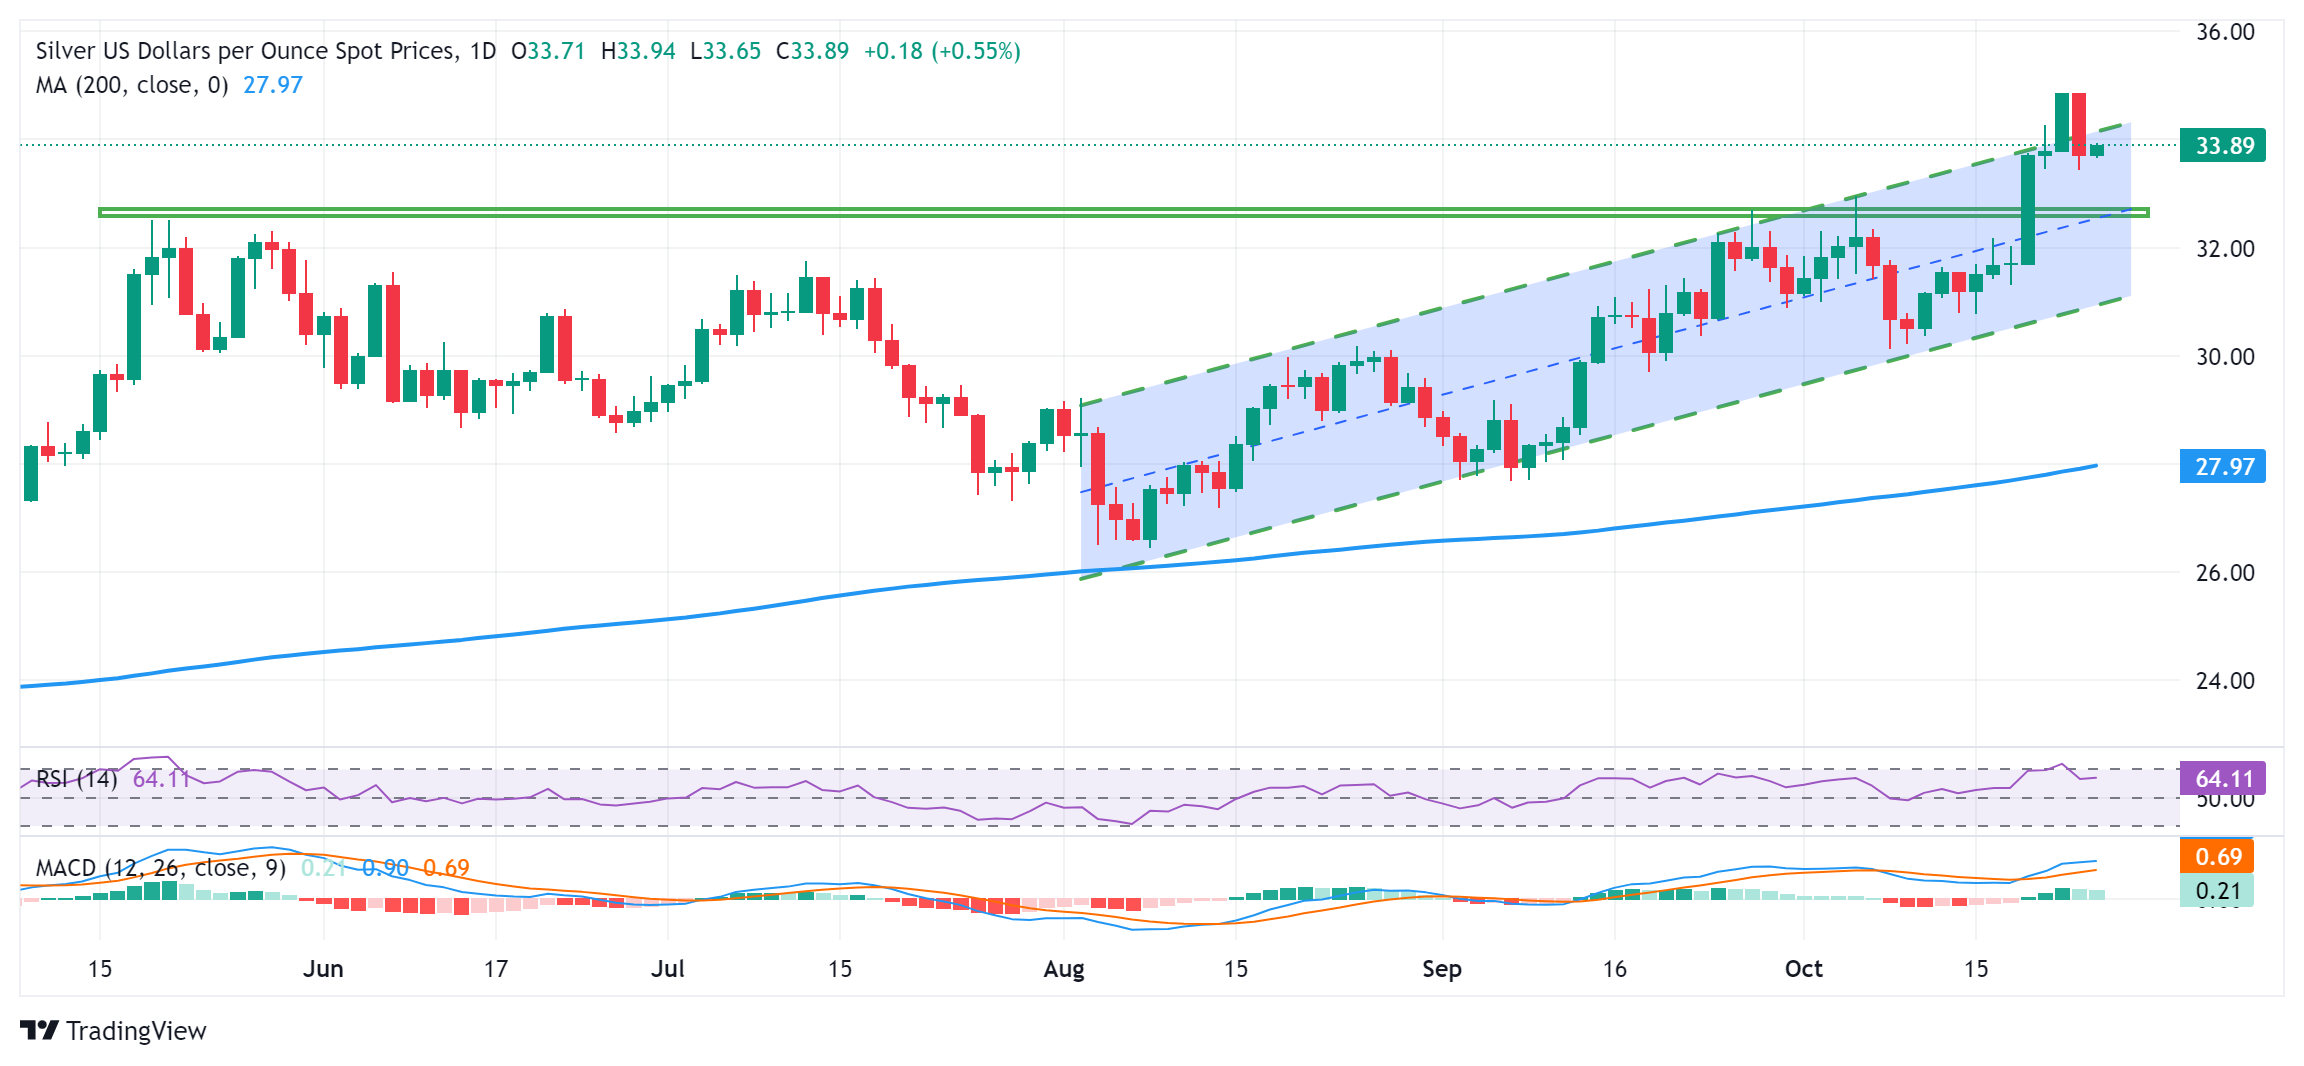
Looking at the broader picture, the recent strength beyond the $32.65-$32.75 supply zone was seen as a fresh trigger for bullish traders. Furthermore, oscillators on the daily chart are holding comfortably in positive territory, suggesting that the path of least resistance for the XAG/USD is to the upside. That said, this week's fake-out above a short-term ascending channel extending from the August swing low warrants some caution.
Hence, it will be prudent to wait for some follow-through buying and a sustained move beyond the $34.25-$34.30 immediate hurdle before positioning for any further gains. The XAG/USD might then accelerate the positive momentum and make a fresh attempt to conquer the $35.00 psychological mark. The momentum could extend further and lift the commodity to the October 2012 swing high, around the $35.35-$35.40 region.
On the flip side, the $33.45-$33.40 area, or the weekly low touched on Wednesday, could protect the immediate downside ahead of the $33.00 round-figure mark. Any further decline is likely to attract some dip-buyers, which, in turn, should limit losses for the XAG/USD near the $32.75-$32.65 resistance-turned-support. Some follow-through selling, however, might shift the bias in favor of bears and pave the way for a further downfall.
Silver daily chart
Silver FAQs
Silver is a precious metal highly traded among investors. It has been historically used as a store of value and a medium of exchange. Although less popular than Gold, traders may turn to Silver to diversify their investment portfolio, for its intrinsic value or as a potential hedge during high-inflation periods. Investors can buy physical Silver, in coins or in bars, or trade it through vehicles such as Exchange Traded Funds, which track its price on international markets.
Silver prices can move due to a wide range of factors. Geopolitical instability or fears of a deep recession can make Silver price escalate due to its safe-haven status, although to a lesser extent than Gold's. As a yieldless asset, Silver tends to rise with lower interest rates. Its moves also depend on how the US Dollar (USD) behaves as the asset is priced in dollars (XAG/USD). A strong Dollar tends to keep the price of Silver at bay, whereas a weaker Dollar is likely to propel prices up. Other factors such as investment demand, mining supply – Silver is much more abundant than Gold – and recycling rates can also affect prices.
Silver is widely used in industry, particularly in sectors such as electronics or solar energy, as it has one of the highest electric conductivity of all metals – more than Copper and Gold. A surge in demand can increase prices, while a decline tends to lower them. Dynamics in the US, Chinese and Indian economies can also contribute to price swings: for the US and particularly China, their big industrial sectors use Silver in various processes; in India, consumers’ demand for the precious metal for jewellery also plays a key role in setting prices.
Silver prices tend to follow Gold's moves. When Gold prices rise, Silver typically follows suit, as their status as safe-haven assets is similar. The Gold/Silver ratio, which shows the number of ounces of Silver needed to equal the value of one ounce of Gold, may help to determine the relative valuation between both metals. Some investors may consider a high ratio as an indicator that Silver is undervalued, or Gold is overvalued. On the contrary, a low ratio might suggest that Gold is undervalued relative to Silver.
Recommended Articles


