
Gold Price Forecast: XAU/USD buyers stay hopeful whilst above 38.2% Fibo level at $2,700
- The US Dollar stalls with Treasury bond yields as Tesla’s earnings report lifts mood.
- Technically, Gold price appears a ‘buy-the-dips’ trade, 38.2% Fibo level holds the key.
Gold price is reversing a part of Wednesday’s correction from record highs of $2,759 early Thursday. Gold buyers draw support from a pause in the US Dollar (USD) advance, as the US Treasury bond yields rally takes a breather in the lead-up to the preliminary S&P Global US PMI data.
Gold price looks to US PMI data for further incentives
The minor pullback in the USD alongside the US Treasury bond yields could be attributed to a stabilizing market mood in Asia, following Wall Street’s tech sell-off overnight. US equity futures rebound amid a risk reset after investors breathed a sigh of relief on Tesla Inc.’s encouraging earnings report.
Tesla reported adjusted earnings of 72 cents per share for the quarter, above the average analyst estimate and snapping four consecutive quarters in which the measure missed expectations, per CNBC News. The company said its Cybertruck, which it first delivered late last year, has reached profitability for the first time,
The further upside in Gold price, however, remains at the mercy of the upcoming Euro area and the US preliminary business PMI data. Investors will seek cues on the health of the global economy, impacting risk sentiment and safe-havens such as the USD, Gold price, etc.
The US S&P Global preliminary Manufacturing PMI is seen ticking higher to 47.5 in October from September’s 47.3 while the Services PMI is set to edge a tad lower to 55.0 in the same period from 55.2 in September.
Meanwhile, the market’s nervousness ahead of key US earnings reports and the presidential election will also play its part in driving the sentiment around Gold price. Any potential decline in Gold price is likely to be bought into, as buyers could re-emerge on Gold’s safe-haven demand due to the November 5 US election and the ongoing Middle East conflict.
Gold price technical analysis: Daily chart
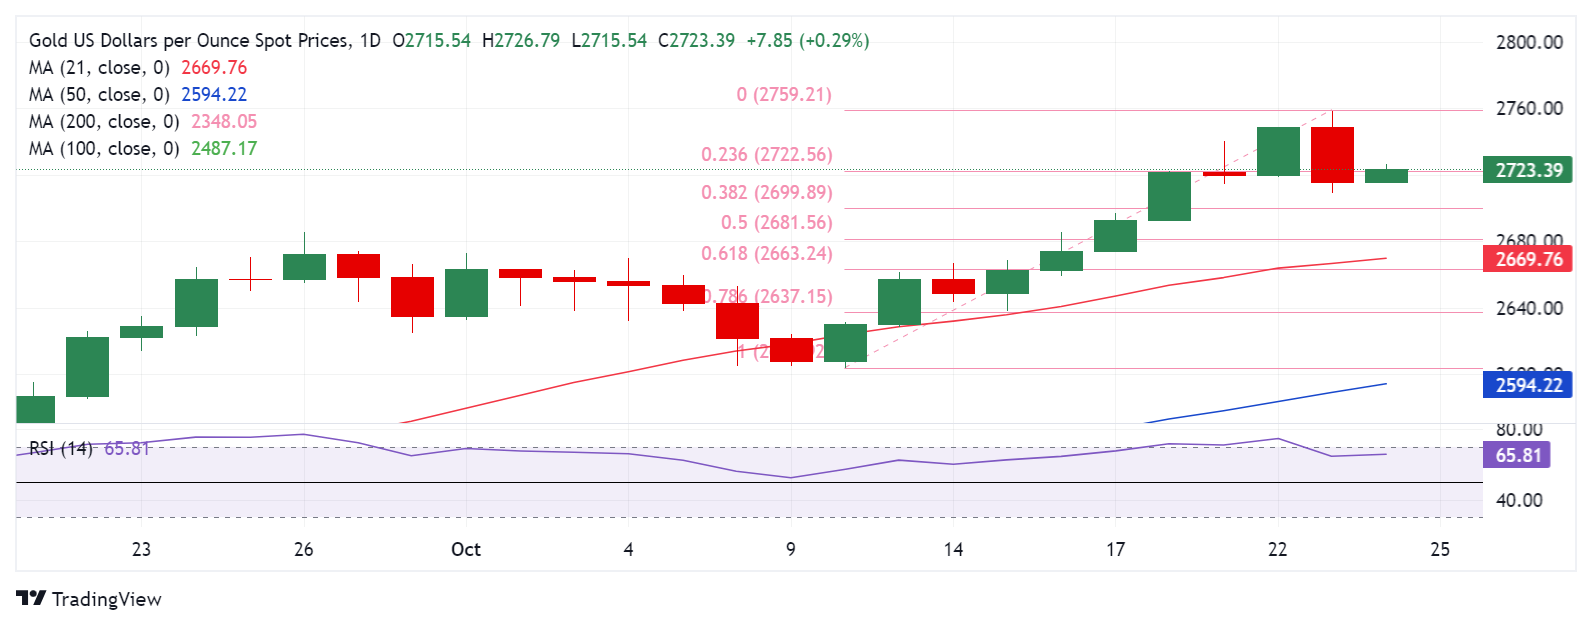
Gold price seems to be facing stiff resistance at $2,723, the 23.6% Fibonacci Retracement (Fibo) level of the latest record rally from the October 10 low of $2,604 to an all-time high of $2,759.
Acceptance above that level could encourage buyers to take on the $2,750 psychological barrier. The record high of $2,759 will be next on buyers’ radars.
The 14-day Relative Strength Index (RSI) is flattish but well above the 50 level, currently trading near 65.60, pointing to more upside momentum.
However, if Gold sellers jump back into the game, the 38.2% Fibo level of the same ascent at $2,700 will come to the rescue of buyers.
A sustained move below the latter will put the 50% Fibo support at $2,682 to the test.
The line in the sand for Gold optimists is aligned at the 21-day Simple Moving Average (SMA) at $2,670.
Recommended Articles


