
Gold closes above 50-day SMA after weak US data
- Gold closes above the 50-day SMA after the release of weak US data increases bets the Fed will lower interest rates.
- Lower interest rates are positive for Gold since they reduce the opportunity cost of holding the non-interest-paying asset.
Gold (XAU/USD) is rising on Thursday to trade in the $2,350s after a string of weak data releases from the US and a change in tone from the Chairman of the Federal Reserve (Fed) Jerome Powell, increased bets the Fed would cut interest rates earlier than previously expected. Such a move would make Gold more attractive as an investment since it is a non-interest-bearing asset.
It is also possible that longer-term investors have been accumulating Gold, ready for another rally due to multiple geopolitical and macro factors that favor the precious metal over the long term.
Gold has successfully closed above the 50-day Simple Moving Average (SMA), which has been capping its gains for several days. This further enhances the outlook for the Yellow Metal from a technical perspective.
Gold breaks through after slew of poor US data
Gold rallies higher after weak data from the US indicates the largest economy in the world is cooling. This suggests inflation will fall more rapidly and makes it more likely the Fed will cut interest rates. Lower interest rates, in turn, make Gold more attractive as an investment because they reduce the opportunity cost of holding the non-interest-paying asset.
The weak US data included the US ISM Services Purchasing Managers Index (PMI), released on Wednesday, which revealed a slowdown in the sector. This is extra significant since the sector has hitherto been a major driver of hot inflation. The June reading showed a fall to 48.8 from 53.8 in May, which was well below the consensus estimate of 52.5. Although the Services Prices Paid component remained in expansion territory at 56.3, that was still lower than the 58.1 in May.
US Jobs data was also sub-par. US Initial Jobless Claims rose 238,000 in the week ending June 29, which was higher than estimates of 235,000 and the previous week’s 233,000. At 1.858 million, Continuing Claims stood at their highest since November 2021. ADP Employment Change, which measures the number of new private employees on the payroll, showed a rise of 150,000 in June, which was below May’s figure and the 160,000 forecast by economists.
The Minutes of June’s Federal Reserve (Fed) meeting maintained a data-dependent neutral tone. The Fed said it wanted to see more progress on inflation, which still stood at 2.7% (before more recent data showed a fall to 2.6%), and weaker economic data in general before pressing a button on interest-rate cuts. This was before Chairman Powell’s speech in Sintra, where he sounded more optimistic about inflation coming down, although he still said more data was required before making a decision on cutting rates.
The anticipation of lower interest rates is positive for Gold as it reduces the opportunity cost of holding the non-interest-paying asset.
Gold gains on broader global backdrop
Gold is seeing further gains from broader, geopolitical and macro factors.
The ongoing conflicts in the Middle East and Ukraine and a political lurch right in Europe are increasing the number of investors opting to store their wealth in Gold.
In the US, the Supreme Court’s decision to grant former US President Donald Trump partial immunity over allegations he incited the uprising that followed his 2020 defeat, combined with question marks over President Joe Biden fitness for office, have increased the chances of a second Trump presidency materializing – something that would further destabilize global security and increase demand for Gold.
Finally, the expansion of the BRICS trading bloc and its expressed aim to de-dollarize global trade has also increased demand for Gold, which is viewed as the most realistic replacement for countries denied access to Dollar-denominated markets.
Technical Analysis: Gold breaks above 50-day SMA
Gold has pierced through and closed above the 50-day SMA, indicating a major bullish shift in its technical profile.
This further invalidates the Head and Shoulders (H&S) topping pattern that looked like it was completing.
XAU/USD Daily Chart
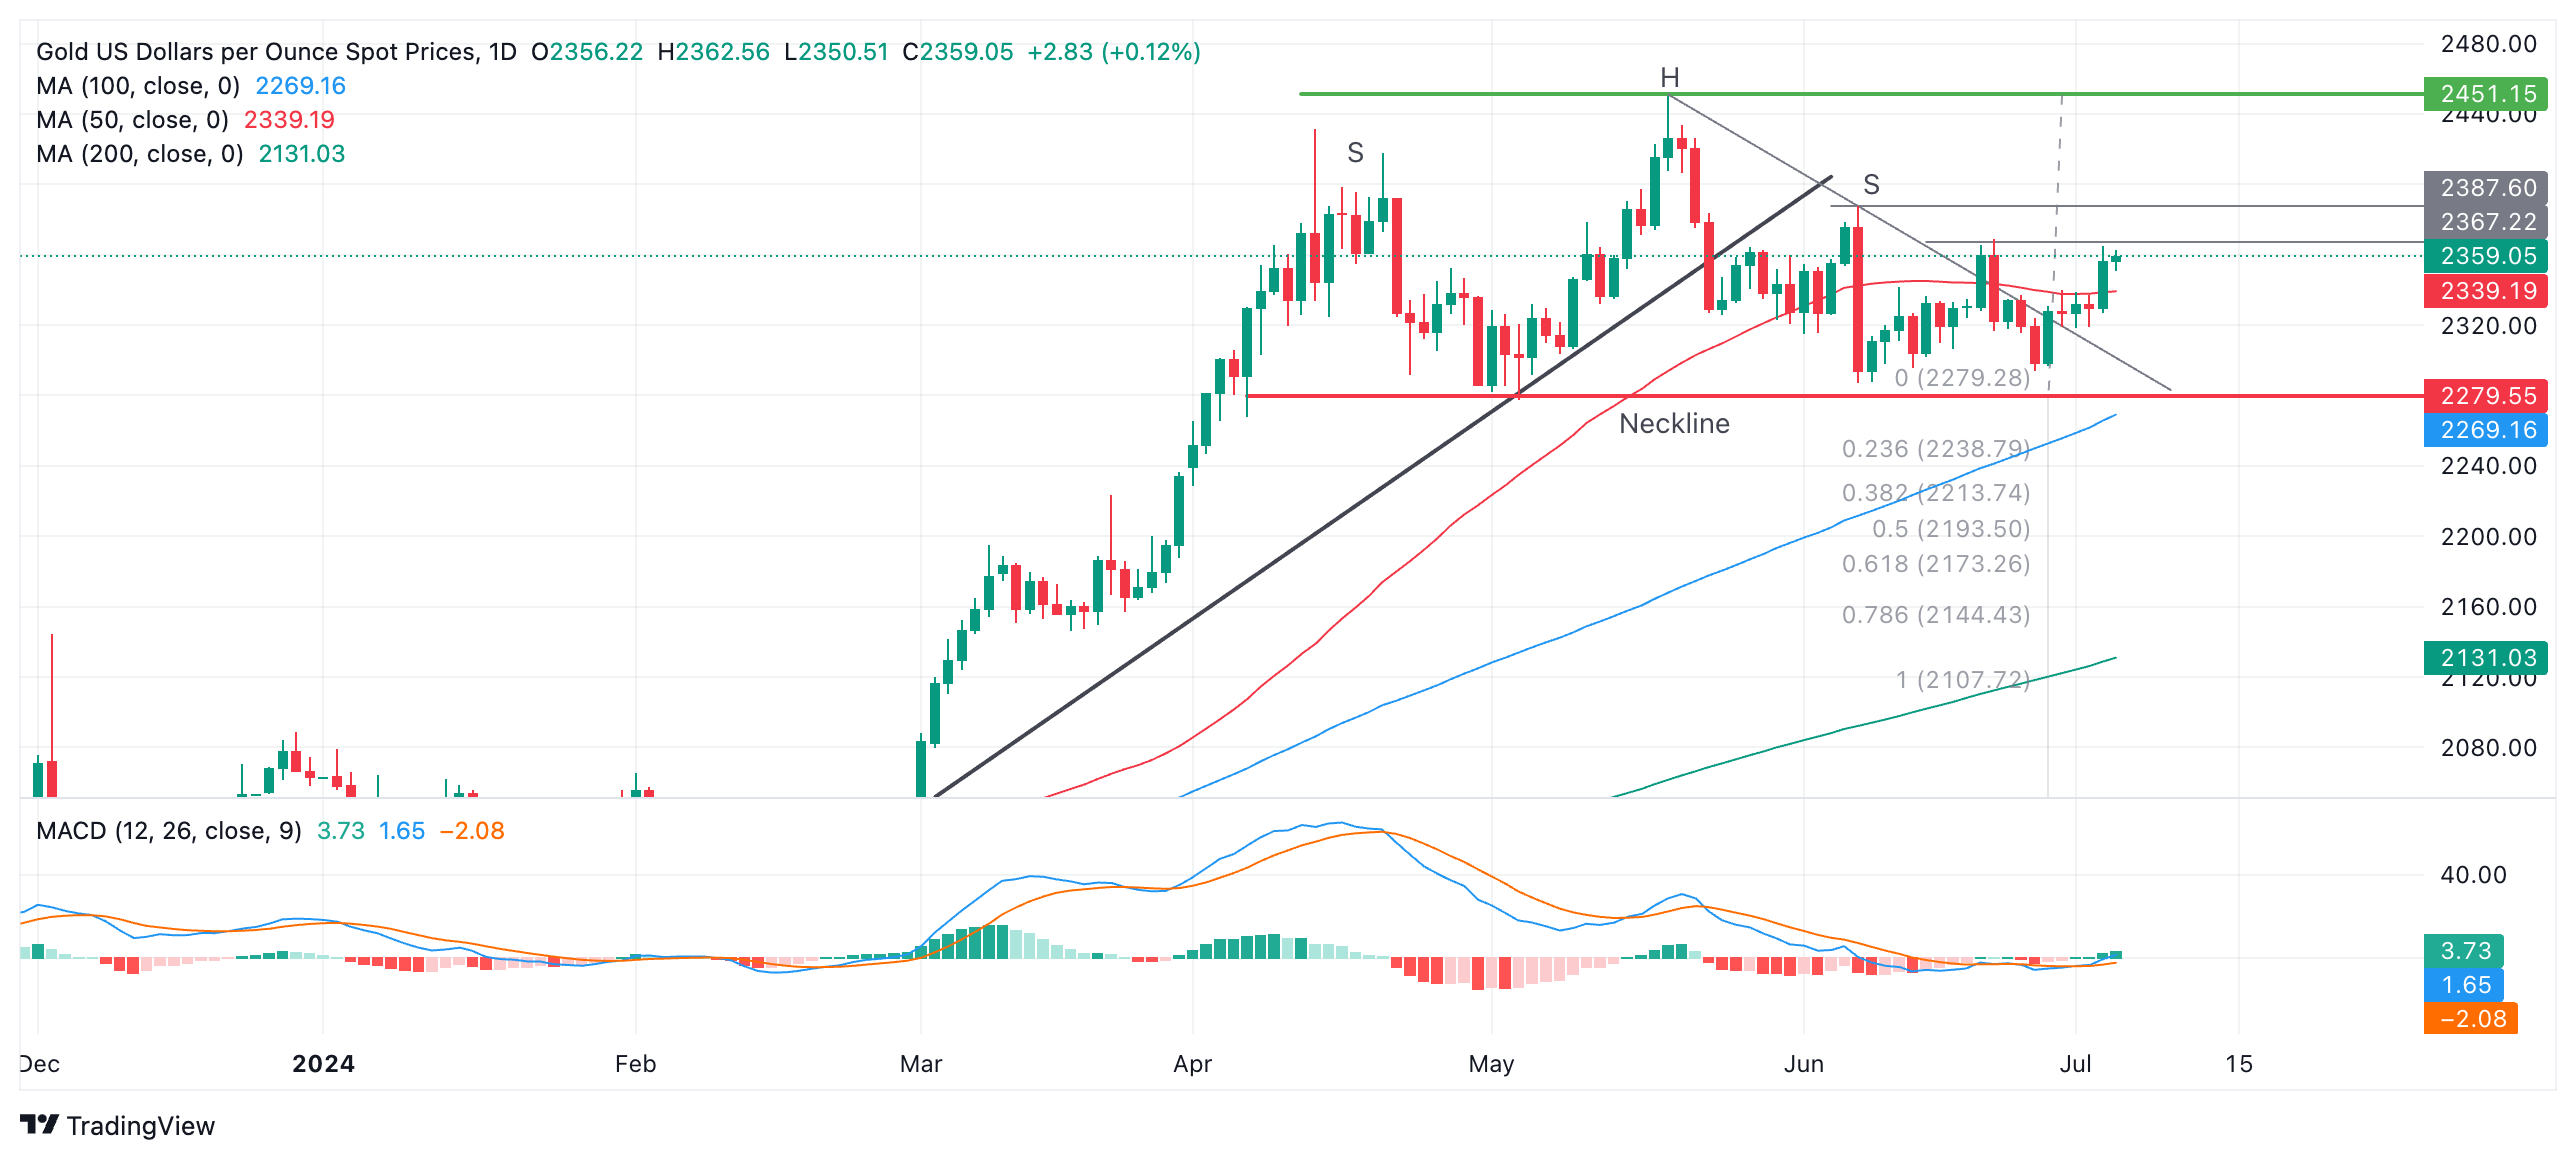
Gold will now probably rise to the $2,369 level (the June 21 high). The next target after that is $2,388, the June 7 high.
Alternatively, despite the invalidation of the H&S, there is still a lesser chance that a more complex topping pattern has formed. If the compromised topping pattern’s neckline at $2,279 is broken, a reversal lower may still follow, with a conservative target at $2,171, the 0.618 ratio of the height of the pattern extrapolated lower.
The trend is now sideways in both the short and medium term. In the long term, Gold remains in an uptrend.
Economic Indicator
ISM Services PMI
The Institute for Supply Management (ISM) Services Purchasing Managers Index (PMI), released on a monthly basis, is a leading indicator gauging business activity in the US services sector, which makes up most of the economy. The indicator is obtained from a survey of supply executives across the US based on information they have collected within their respective organizations. Survey responses reflect the change, if any, in the current month compared to the previous month. A reading above 50 indicates that the services economy is generally expanding, a bullish sign for the US Dollar (USD). A reading below 50 signals that services sector activity is generally declining, which is seen as bearish for USD.
Read more.Last release: Wed Jul 03, 2024 14:00
Frequency: Monthly
Actual: 48.8
Consensus: 52.5
Previous: 53.8
Source: Institute for Supply Management
The Institute for Supply Management’s (ISM) Services Purchasing Managers Index (PMI) reveals the current conditions in the US service sector, which has historically been a large GDP contributor. A print above 50 shows expansion in the service sector’s economic activity. Stronger-than-expected readings usually help the USD gather strength against its rivals. In addition to the headline PMI, the Employment Index and the Prices Paid Index numbers are also watched closely by investors as they provide useful insights regarding the state of the labour market and inflation.
Recommended Articles


