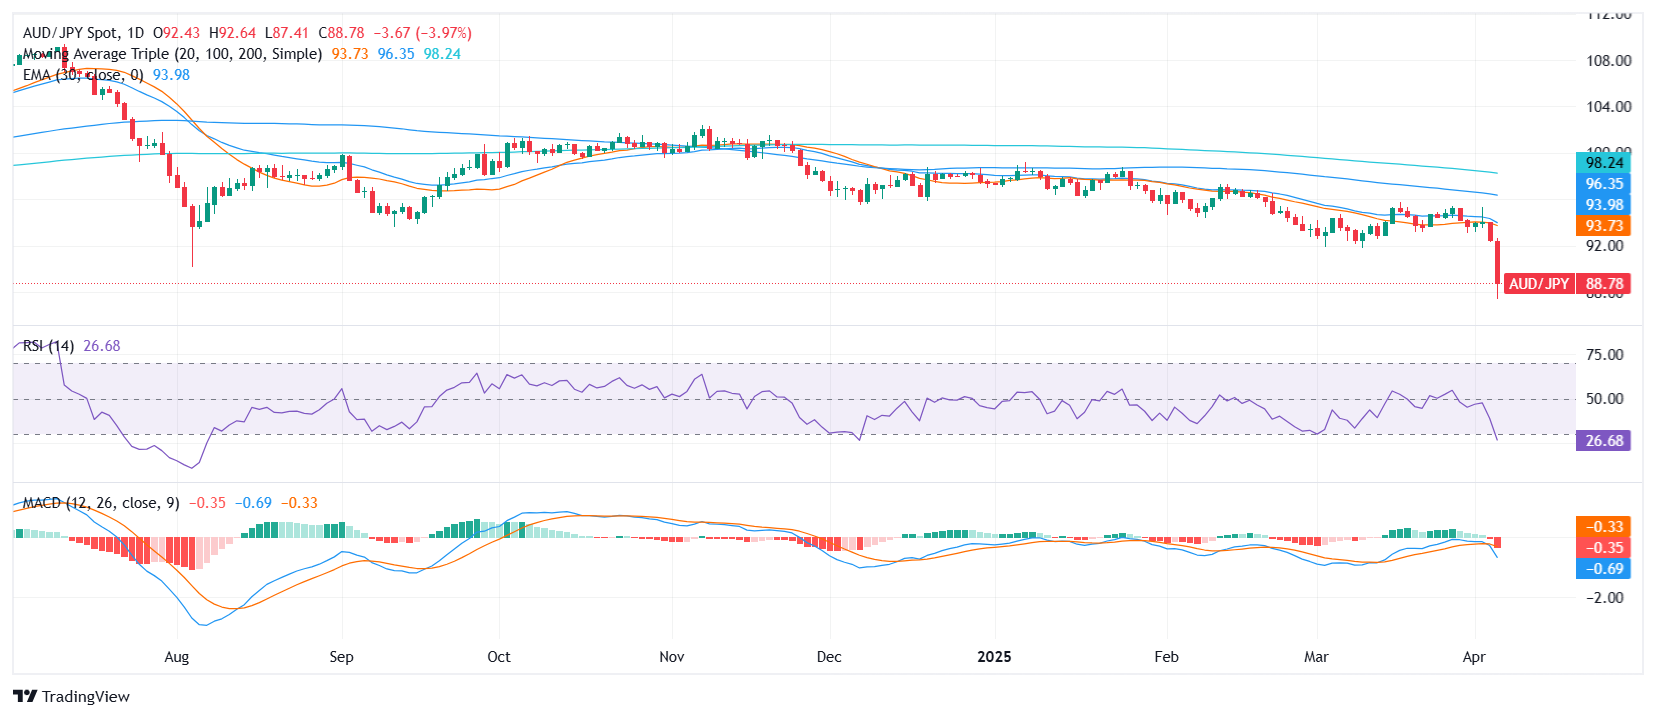
AUD/JPY Price Analysis: Heavy losses drag pair near 88.60 as bearish momentum accelerates
- AUD/JPY plunged near the 88.60 zone on Friday, marking a sharp retreat ahead of the Asian session.
- MACD confirms a sell signal as the pair faces broad bearish pressure despite neutral oscillators.
- Key resistance stands at 91.53 and 92.92, while moving averages point to extended downside risk.
The AUD/JPY pair tumbled aggressively on Friday, retreating toward the 88.60 area after shedding over 4% during the day. The move represents one of the steepest intraday declines in recent sessions, dragging the pair away from the recent highs and into a mid-range zone between 87.41 and 92.64. The plunge comes as broader technicals align in favor of sellers, even as some oscillators remain neutral.
Daily chart

Technical indicators reflect a clearly bearish outlook. The Moving Average Convergence Divergence (MACD) is flashing a strong sell signal, reinforcing downside momentum. Meanwhile, the Relative Strength Index (RSI) sits at 25.56, still neutral but nearing oversold territory. Other momentum measures, such as the Awesome Oscillator (-1.112) and the Ultimate Oscillator (36.03), also remain in neutral zones, suggesting that the momentum may still be building rather than exhausted.
Supportive of the bearish structure, all key moving averages are aligned lower. The 20-day Simple Moving Average (SMA) at 93.72, the 100-day SMA at 96.42, and the 200-day SMA at 98.35 are all reinforcing sustained downside pressure. The 10-day Exponential Moving Average (EMA) and 10-day SMA, both hovering around 92.92–93.61, now act as firm resistance following the latest breakdown.

