
GBP/USD climbs above 1.2920 as trade war fears weaken USD
- Trump imposes additional 25% duties on Canadian aluminum and steel, triggering retaliation.
- JOLTS job openings beat forecasts, rising to 7.74 million in January.
- Markets price in 82 bps of Fed rate cuts, increasing July easing expectations.
- Traders eye US CPI data on Wednesday and UK GDP figures for further direction.
The Pound Sterling extended its gains versus the US Dollar on Tuesday as the latter continued to plunge, due controversial trade policies by US President Donald Trump, adding an additional 25% in aluminum and steel imports from Canada, as the latter apply duties on electricity imported to New York, Michigan and Minnesota. The GBP/USD trades at 1.2924 up 0.38%.
Sterling up 0.38% as US tariffs on Canada fuel risk aversion
Market mood remains dismal due to the ongoing trade war, favoring most G10 currencies except the Greenback. The US Job Openings and Labor Turnover Survey (JOLTS) report revealed that vacancies increased in January from 7.508 million to 7.740 million, exceeding forecasts of 7.63 million.
The GBP/USD erased Monday’s losses and climbs past 1.2900 as market participants continued to price in additional easing by the Federal Reserve. Data from the Chicago Board of Trade (CBOT) showed that investors estimate the US Central Bank to ease policy 82 basis points.
Despite the recent uptrend in the GBP/USD, analysts suggest it will likely stall in the medium term. Nick Rees, Head of Macro research at Monex Europe, said that while US recession fears were “overdone,” currency markets “could be wrong for an extended period.”
Meanwhile, traders will be eyeing February’s US inflation report on Wednesday. Most analysts foresee continuing the disinflation process, which could increase the chances for a Fed rate cut in July. Across the pond, investors are eyeing the release of January's Gross Domestic Product (GDP) figures.
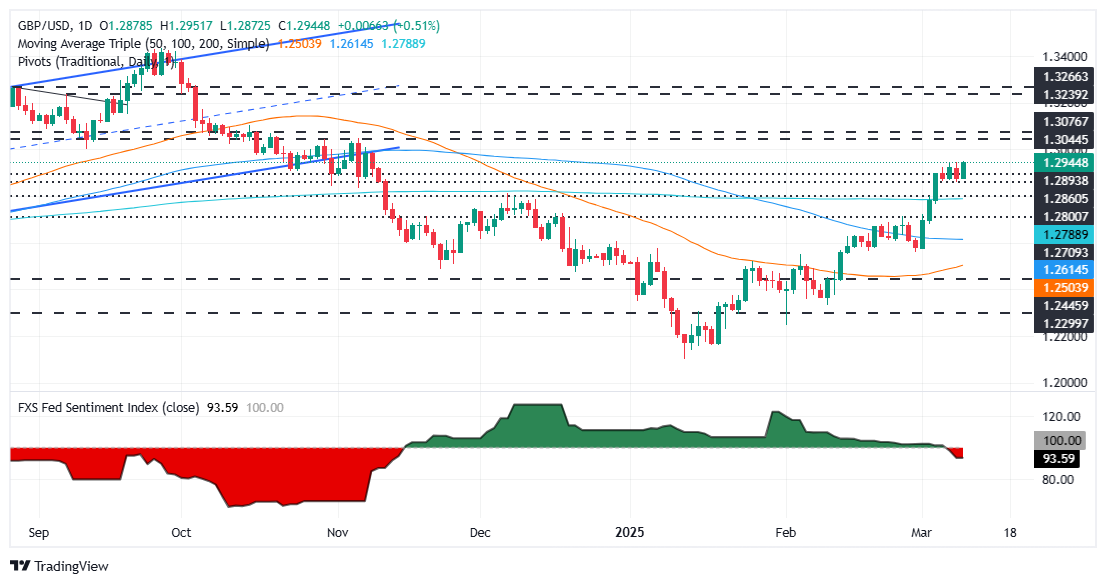
GBP/USD Price Forecast: Technical outlook
The GBP/USD remains upward biased after carving a successive series of higher highs and higher lows. Nevertheless, the trend has lost some steam as the Relative Strength Index (RSI) reaches overbought conditions, which could pave the way for a correction. Despite this, if the pair clears 1.2950, a move to 1.3000 is likely. Otherwise, a drop below 1.2900, could exacerbate a retracement towards the 200-day Simple Moving Average (SMA) at 1.2789.
British Pound PRICE Today
The table below shows the percentage change of British Pound (GBP) against listed major currencies today. British Pound was the strongest against the Canadian Dollar.
| USD | EUR | GBP | JPY | CAD | AUD | NZD | CHF | |
|---|---|---|---|---|---|---|---|---|
| USD | -0.74% | -0.50% | 0.25% | 0.24% | -0.06% | -0.11% | -0.10% | |
| EUR | 0.74% | 0.25% | 1.02% | 0.99% | 0.69% | 0.64% | 0.65% | |
| GBP | 0.50% | -0.25% | 0.61% | 0.74% | 0.44% | 0.39% | 0.41% | |
| JPY | -0.25% | -1.02% | -0.61% | -0.01% | -0.31% | -0.37% | -0.34% | |
| CAD | -0.24% | -0.99% | -0.74% | 0.01% | -0.29% | -0.34% | -0.33% | |
| AUD | 0.06% | -0.69% | -0.44% | 0.31% | 0.29% | -0.04% | -0.02% | |
| NZD | 0.11% | -0.64% | -0.39% | 0.37% | 0.34% | 0.04% | 0.02% | |
| CHF | 0.10% | -0.65% | -0.41% | 0.34% | 0.33% | 0.02% | -0.02% |
The heat map shows percentage changes of major currencies against each other. The base currency is picked from the left column, while the quote currency is picked from the top row. For example, if you pick the British Pound from the left column and move along the horizontal line to the US Dollar, the percentage change displayed in the box will represent GBP (base)/USD (quote).
Recommended Articles


