
NZD/USD Price Forecast: Could retest 0.5700 support near 50-day EMA
- NZD/USD may aim for initial resistance at the three-month high of 0.5794, reached on January 24.
- The 14-day Relative Strength Index remains above 50, reinforcing the bullish outlook.
- Immediate support is seen at the psychological level of 0.5700, aligning with the 50-day EMA at 0.5698.
The NZD/USD pair loses ground after registering gains in the previous four successive sessions, trading around 0.5720 during European trading hours on Friday. Technical analysis of the daily chart indicates a bullish bias, with the pair trending higher within a newly formed ascending channel pattern.
The 14-day Relative Strength Index (RSI) remains above the 50 mark, reinforcing the bullish outlook. However, NZD/USD is positioned above the nine-day Exponential Moving Average (EMA), signaling short-term momentum is stronger.
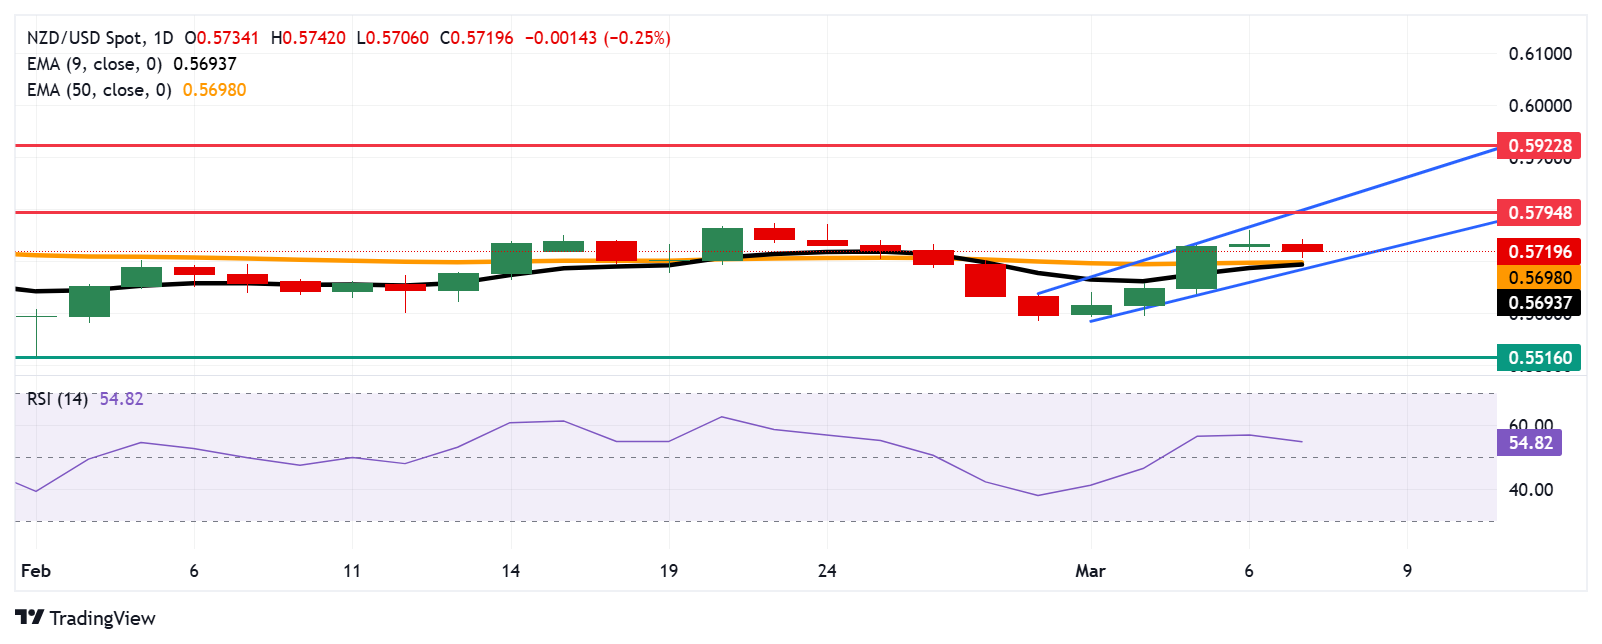
A recovery could see the pair targeting initial resistance at the three-month high of 0.5794, reached on January 24, which is aligned with the upper boundary of the ascending channel at 0.5800 level. A break above this crucial resistance zone could reinforce the prevailing bullish bias and support the NZD/USD pair to explore the region around the four-month high at 0.5922 level, recorded in December 2024.
On the downside, immediate support is seen at the psychological level of 0.5700, coinciding with the 50-day EMA at 0.5698 and the nine-day EMA at 0.5694, aligning with the lower boundary of the ascending channel.
A decisive break below the ascending channel could weaken the bullish bias and put downward pressure on the NZD/USD pair to navigate the area around 0.5516—its lowest level since October 2022, recorded on February 3.
NZD/USD: Daily Chart
New Zealand Dollar PRICE Today
The table below shows the percentage change of New Zealand Dollar (NZD) against listed major currencies today. New Zealand Dollar was the weakest against the Euro.
| USD | EUR | GBP | JPY | CAD | AUD | NZD | CHF | |
|---|---|---|---|---|---|---|---|---|
| USD | -0.45% | -0.19% | -0.19% | -0.01% | 0.36% | 0.21% | -0.41% | |
| EUR | 0.45% | 0.27% | 0.27% | 0.44% | 0.81% | 0.67% | 0.04% | |
| GBP | 0.19% | -0.27% | 0.04% | 0.17% | 0.54% | 0.40% | -0.20% | |
| JPY | 0.19% | -0.27% | -0.04% | 0.17% | 0.54% | 0.40% | -0.19% | |
| CAD | 0.01% | -0.44% | -0.17% | -0.17% | 0.36% | 0.23% | -0.37% | |
| AUD | -0.36% | -0.81% | -0.54% | -0.54% | -0.36% | -0.14% | -0.72% | |
| NZD | -0.21% | -0.67% | -0.40% | -0.40% | -0.23% | 0.14% | -0.59% | |
| CHF | 0.41% | -0.04% | 0.20% | 0.19% | 0.37% | 0.72% | 0.59% |
The heat map shows percentage changes of major currencies against each other. The base currency is picked from the left column, while the quote currency is picked from the top row. For example, if you pick the New Zealand Dollar from the left column and move along the horizontal line to the US Dollar, the percentage change displayed in the box will represent NZD (base)/USD (quote).
Recommended Articles


