NZD/JPY price analysis: Bullish momentum dominates, indicators flash overbought conditions

Source Fxstreet
  • The NZD/JPY pair rallied by 0.53% and stands at 92.88 as of Wednesday's session.
  • The daily RSI shows strong buying momentum, reaching overbought conditions.
  • A healthy technical correction may be on the horizon in the next sessions.

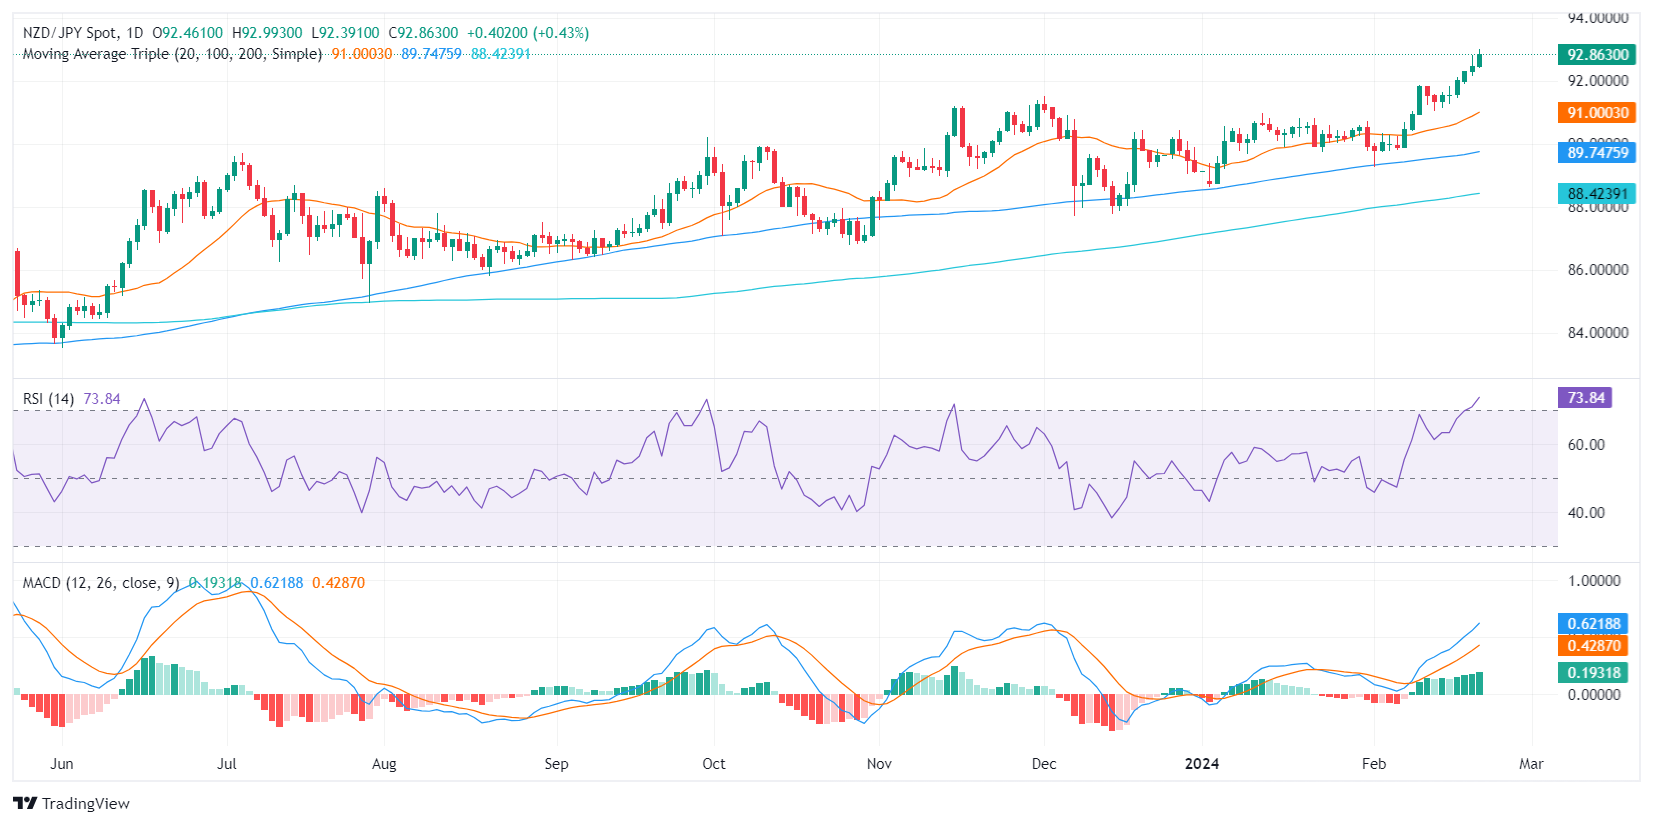
In Wednesday's session, the NZD/JPY was observed trading at 92.88, marking a 0.53% rally in its progress. The pair reveals sustained buying momentum with the Relative Strength Index (RSI), dwelling in the overbought zone indicating that a pullback may be incoming.

In the daily chart, the Relative Strength Index (RSI) consistently resides in the overbought, and the NZD/JPY pair shows signs of strong buying momentum. Notably, there's been a persistently positive slope, indicating a continued bullish undercurrent. To support this, the Moving Average Convergence Divergence (MACD) histogram is displaying green bars, marking positive momentum. It's been on a steady rise, further underlining the dominance of buyers.

NZD/JPY daily chart
Shifting attention to the hourly chart, the RSI hovers flat in both the positive area and the MACD histogram continues to print green bars, alluding to an overall bullish momentum despite interim dips.

NZD/JPY hourly chart
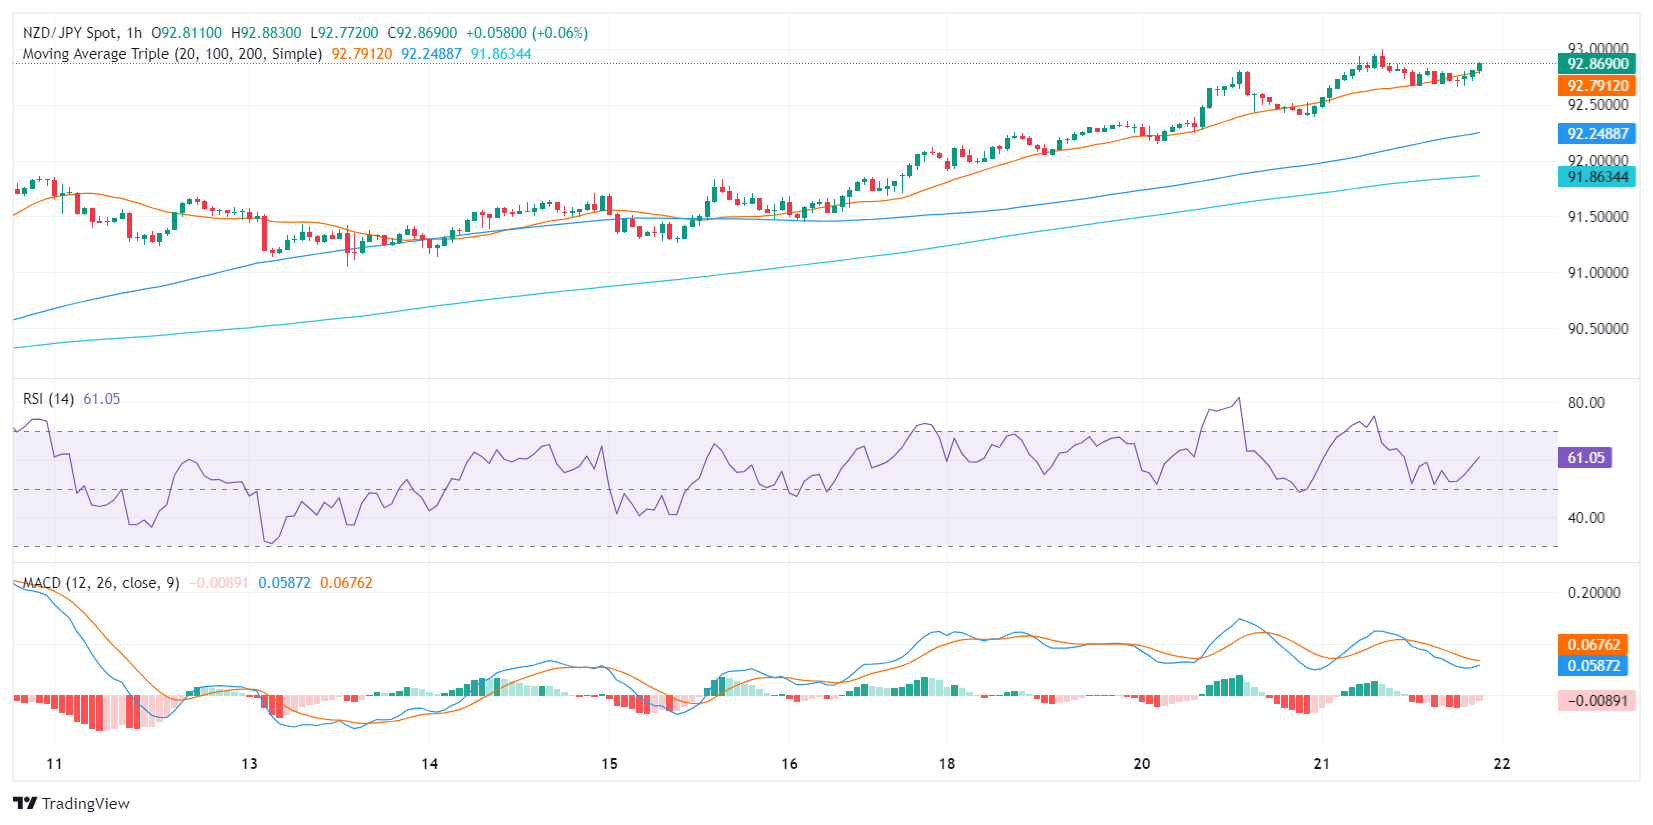
Overall, despite the short-term flattening depicted in the hourly chart, the significant bullish signals from the daily RSI and both MACD histograms suggest the pair might adhere to an upward trend. Moreover, the NZDJPY stands above its 20,100,200-day Simple Moving Averages (SMAs), reinforcing the predominance of the bulls. However, traders should consider the possibility of a correction in the next session, to consolidate gains.


Disclaimer: For information purposes only. Past performance is not indicative of future results.
placeholder
Bitcoin Price Bounces Back—Can It Finally Break Resistance?Bitcoin price started a recovery wave above the $83,500 zone. BTC is now consolidating and might struggle to settle above the $85,500 zone. Bitcoin started a decent recovery wave above the $83,500
Author  NewsBTC
Apr 02, Wed
Bitcoin price started a recovery wave above the $83,500 zone. BTC is now consolidating and might struggle to settle above the $85,500 zone. Bitcoin started a decent recovery wave above the $83,500
placeholder
U.S. March Nonfarm Payroll Preview: Even If Data Aligns with Expectations, Financial Markets May Not Escape the Fate of VolatilityOn 4 April 2025, the United States will release its March Nonfarm Payrolls (NFP) data. The market consensus currently anticipates job growth of 128,000, a decline from February’s 151,000 (Figure 1). W
Author  TradingKey
Apr 02, Wed
On 4 April 2025, the United States will release its March Nonfarm Payrolls (NFP) data. The market consensus currently anticipates job growth of 128,000, a decline from February’s 151,000 (Figure 1). W
placeholder
Japanese Yen spikes to multi-week high against USD after Trump’s tariffs announcementThe Japanese Yen (JPY) jumped to a three-week top against its American counterpart during the Asian session on Thursday after US President Donald Trump imposed sweeping trade tariffs.
Author  FXStreet
23 hours ago
The Japanese Yen (JPY) jumped to a three-week top against its American counterpart during the Asian session on Thursday after US President Donald Trump imposed sweeping trade tariffs.
placeholder
Bitcoin price reacts as Gold sets fresh record highs after Trump’s reciprocal tariffs announcementBitcoin price plunges towards $82,000 as Gold soars past $3,150 after US President Donald Trump imposed new tariffs on Israel and UK, triggering global markets turbulence.
Author  FXStreet
23 hours ago
Bitcoin price plunges towards $82,000 as Gold soars past $3,150 after US President Donald Trump imposed new tariffs on Israel and UK, triggering global markets turbulence.
placeholder
Bitcoin Price Forecast: Tariff volatility sweeps over $200 billion from crypto marketsBitcoin (BTC) price hovers around $83,000 at the time of writing on Thursday after it failed to close above a critical resistance level the previous day.
Author  FXStreet
16 hours ago
Bitcoin (BTC) price hovers around $83,000 at the time of writing on Thursday after it failed to close above a critical resistance level the previous day.
Related Instrument
goTop
quote