


GBP/USD drops below 1.2600 as US Dollar gains on risk aversion
- GBP/USD falls 0.21% as Trump’s tariff threats fuel safe-haven demand.
- UK CPI jumps to 3%, exceeding forecasts, but BoE’s easing path remains intact.
- FOMC minutes in focus as Fed signals no rush to cut rates.
The Pound Sterling retreated below 1.2600 during the North American session as housing data in the United States was mixed, while inflation in the United Kingdom hit its highest level since March 2024. Despite this, the GBP/USD trades at 1.2585, down 0.21%.
Pound weakens despite UK inflation surge, as Fed stance limits upside
Risk appetite spurred demand for haven assets like the Greenback after US President Donald Trump threatened to apply 25% tariffs on autos, pharmaceuticals, and chips. In the meantime, Housing Starts in the US tumbled in January due to weather disruptions, dropping from 1.515 million to 1.366 million, or a 9.6% plunge.
The US Census Bureau revealed that US Building Permits for the same period improved, with figures rising from 1.482 million to 1.483 million, a 0.1% increase.
Aside from this, investors await the release of the latest Federal Open Market Committee (FOMC) monetary policy meeting. In the last meeting, the Fed tweaked its language, removing the progress on inflation, emphasizing that it “remains somewhat elevated,” a slight hawkish tilt. Since then, most officials adhered to a more neutral stance saying the Central Bank is not in a rush to ease policy.
This favors further GBP/USD downside as the interest rate differential between the UK and the US reduced, as the BoE cut rates earlier this month.
Nevertheless, during the European Session, the UK's Consumer Price Index (CPI) rose by 3% in January, exceeding the economists’ forecast of a 2.8% increase. The Office for National Statistics (ONS) blamed the jump in inflation on a smaller-than-expected drop in airfares and rising petrol prices.
Given the fundamental backdrop, the GBP/USD might consolidate. The increase in wage growth figures and inflation would be challenging for the BoE, which embarked on an easing cycle. However, a minimum wage of 7% is due to start in April, and an economic slowdown paints a stagflationary scenario for the UK.
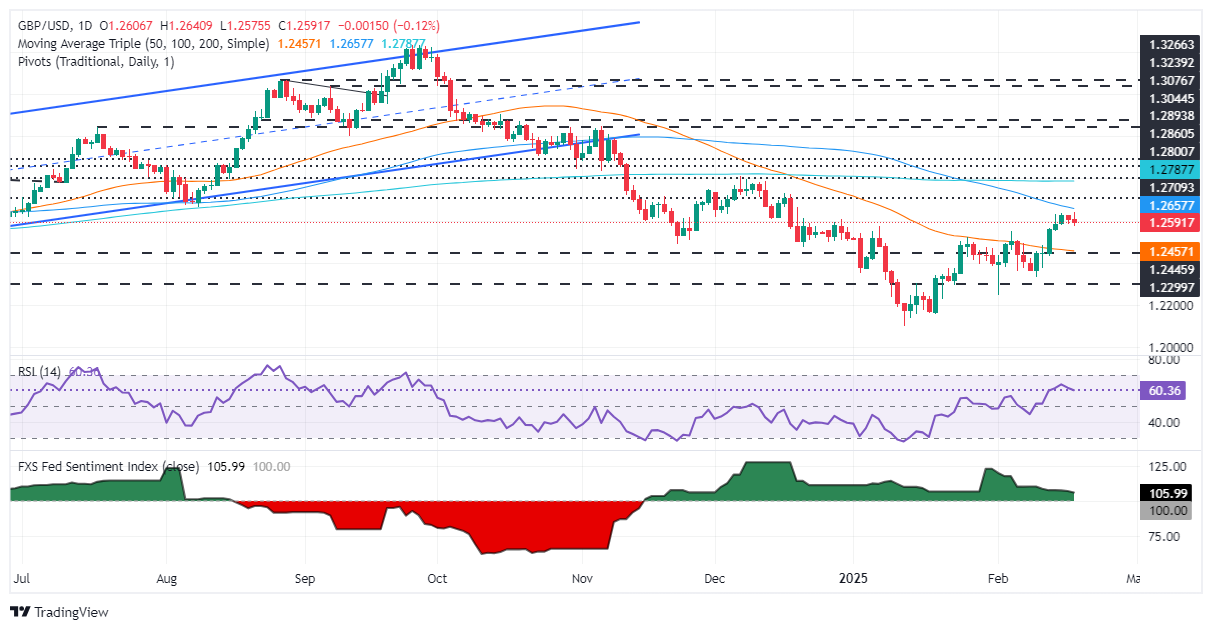
GBP/USD Price Analysis: Technical outlook
The GBP/USD dropped below 1.2600 following the release of US economic data. As risk appetite deteriorates, the Greenback climbs, and the pair hits a three-day low of 1.2578. Although the Relative Strength Index (RSI) remains bullish, buyers have lost a step, as the RSI aims lower. That said, if the pair drops below the February 5 high of 1.2549, a test of the 50-day Simple Moving Average (SMA) at 1.2463 is on the cards.
On the other hand, buyers reclaiming 1.2600 could challenge the year-to-date (YTD) peak at 1.2639.
British Pound PRICE Today
The table below shows the percentage change of British Pound (GBP) against listed major currencies today. British Pound was the strongest against the Canadian Dollar.
| USD | EUR | GBP | JPY | CAD | AUD | NZD | CHF | |
|---|---|---|---|---|---|---|---|---|
| USD | 0.13% | 0.12% | -0.47% | 0.14% | 0.07% | -0.14% | -0.07% | |
| EUR | -0.13% | -0.01% | -0.60% | 0.00% | -0.03% | -0.27% | -0.20% | |
| GBP | -0.12% | 0.00% | -0.59% | 0.02% | -0.05% | -0.27% | -0.19% | |
| JPY | 0.47% | 0.60% | 0.59% | 0.59% | 0.53% | 0.30% | 0.39% | |
| CAD | -0.14% | -0.01% | -0.02% | -0.59% | -0.06% | -0.28% | -0.21% | |
| AUD | -0.07% | 0.03% | 0.05% | -0.53% | 0.06% | -0.22% | -0.14% | |
| NZD | 0.14% | 0.27% | 0.27% | -0.30% | 0.28% | 0.22% | 0.08% | |
| CHF | 0.07% | 0.20% | 0.19% | -0.39% | 0.21% | 0.14% | -0.08% |
The heat map shows percentage changes of major currencies against each other. The base currency is picked from the left column, while the quote currency is picked from the top row. For example, if you pick the British Pound from the left column and move along the horizontal line to the US Dollar, the percentage change displayed in the box will represent GBP (base)/USD (quote).
Recommended Articles


