NZD/USD Price Forecast: Remains subdued below nine-day EMA at 0.5650

Source Fxstreet
  • NZD/USD could explore the area around the psychological level of 0.5600.
  • The 14-day RSI remains below the 50 mark, strengthening the bearish sentiment.
  • The immediate barrier appears at the nine-day EMA of 0.5650 level.

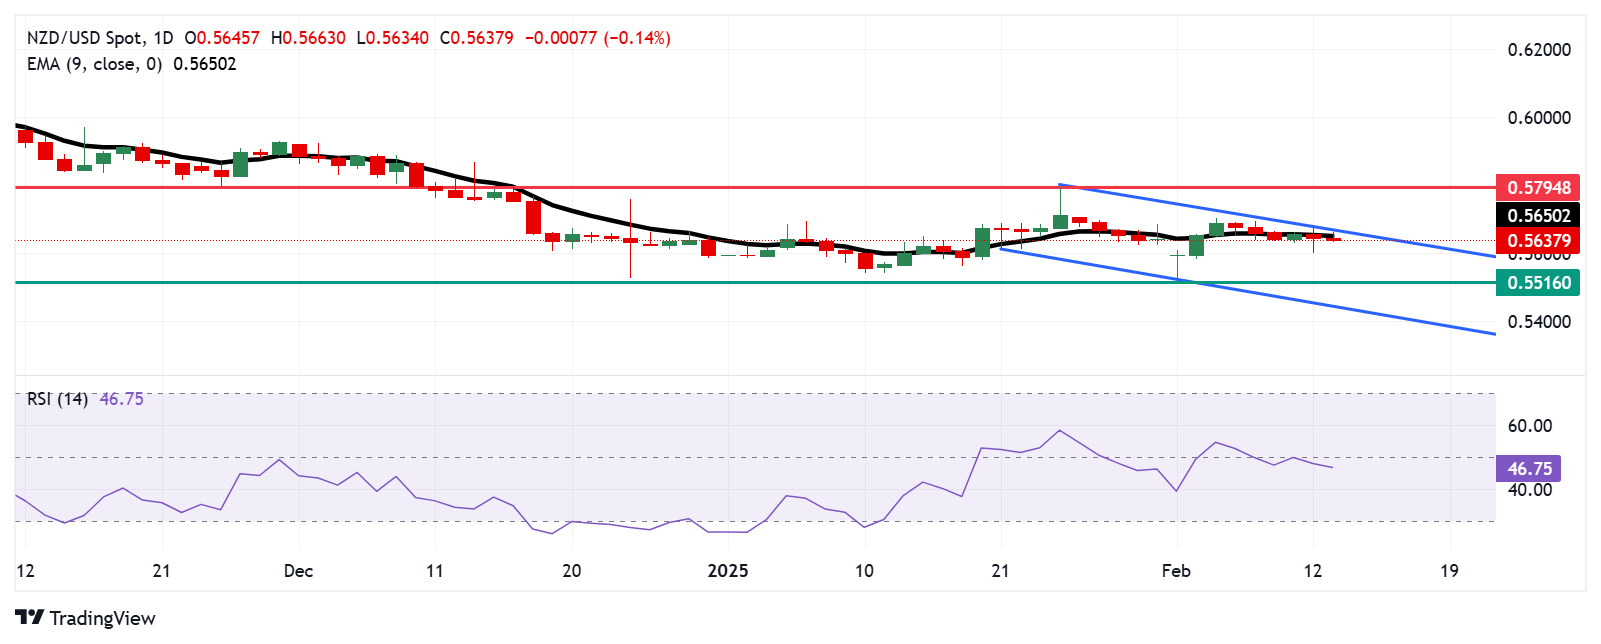
The NZD/USD pair continues its decline for the second consecutive day, trading near 0.5640 during European hours on Thursday. Technical analysis of the daily chart indicates a bearish market sentiment, with the pair remaining within a descending channel pattern.

The 14-day Relative Strength Index (RSI) stays below the 50 mark, reinforcing the bearish outlook. Additionally, the NZD/USD pair remains under the nine-day Exponential Moving Average (EMA), signaling weak short-term momentum.

On the downside, the NZD/USD pair could explore the support region around the psychological level of 0.5600. A decisive break below this level could drive the pair toward 0.5516, its lowest point since October 2022, recorded on February 3. Further support lies near the lower boundary of the descending channel at 0.5450.

To the upside, the NZD/USD pair's immediate resistance is at the nine-day EMA of 0.5650, followed by the descending channel’s lower boundary at 0.5670. A breakout above this critical resistance zone could ease the bearish bias, potentially pushing the pair toward its nine-week high of 0.5794, reached on January 24.

NZD/USD: Daily Chart
New Zealand Dollar PRICE Today

The table below shows the percentage change of New Zealand Dollar (NZD) against listed major currencies today. New Zealand Dollar was the weakest against the Swiss Franc.

  USD EUR GBP JPY CAD AUD NZD CHF
USD   -0.24% -0.28% -0.32% 0.08% 0.25% 0.12% -0.65%
EUR 0.24%   -0.04% -0.06% 0.32% 0.47% 0.37% -0.41%
GBP 0.28% 0.04%   -0.06% 0.37% 0.53% 0.41% -0.37%
JPY 0.32% 0.06% 0.06%   0.40% 0.57% 0.40% -0.33%
CAD -0.08% -0.32% -0.37% -0.40%   0.18% 0.05% -0.74%
AUD -0.25% -0.47% -0.53% -0.57% -0.18%   -0.12% -0.90%
NZD -0.12% -0.37% -0.41% -0.40% -0.05% 0.12%   -0.78%
CHF 0.65% 0.41% 0.37% 0.33% 0.74% 0.90% 0.78%  

The heat map shows percentage changes of major currencies against each other. The base currency is picked from the left column, while the quote currency is picked from the top row. For example, if you pick the New Zealand Dollar from the left column and move along the horizontal line to the US Dollar, the percentage change displayed in the box will represent NZD (base)/USD (quote).


Disclaimer: For information purposes only. Past performance is not indicative of future results.
placeholder
Japanese Yen dives to one-week low against USD amid rising trade tensionsThe Japanese Yen (JPY) drifts lower for the third straight day on Wednesday and slides to a one-week low against its American counterpart during the Asian session.
Author  FXStreet
Yesterday 02: 41
The Japanese Yen (JPY) drifts lower for the third straight day on Wednesday and slides to a one-week low against its American counterpart during the Asian session.
placeholder
Best Stock to Buy Right Now: Amazon vs AppleAmazon (NASDAQ: AMZN) and Apple (NASDAQ: AAPL) have become among the world's most recognized companies. They've also become very valuable, with the former's market cap exceeding $2
Author  The Motley Fool
Yesterday 10: 02
Amazon (NASDAQ: AMZN) and Apple (NASDAQ: AAPL) have become among the world's most recognized companies. They've also become very valuable, with the former's market cap exceeding $2
placeholder
Goldman Sachs’ Bitcoin ETF Bet Soars To $1.5 BillionGoldman Sachs has ramped up its spot Bitcoin exchange-traded fund (ETF) holdings to over $1.5 billion, underscoring its deepening commitment to cryptocurrencies in the final quarter of 2024. The latest 13F filing with the US Securities and Exchange Commission (SEC) shows a notable expansion in both BTC and Ethereum-related positions, reflecting growing institutional confidence in […]
Author  Bitcoinist
11 hours ago
Goldman Sachs has ramped up its spot Bitcoin exchange-traded fund (ETF) holdings to over $1.5 billion, underscoring its deepening commitment to cryptocurrencies in the final quarter of 2024. The latest 13F filing with the US Securities and Exchange Commission (SEC) shows a notable expansion in both BTC and Ethereum-related positions, reflecting growing institutional confidence in […]
placeholder
Dogecoin Price Breakout From Robust Structure Zone Signals Sharp 50% Rise Above $0.33Technical analysis shows that Dogecoin is looking to break out from a key structure zone near $0.26, which could cause a change in market momentum. This technical outlook comes amidst a bearish week for DOGE, which has seen it breaking below support levels and erasing its gains throughout January. According to a technical analysis of […]
Author  Bitcoinist
10 hours ago
Technical analysis shows that Dogecoin is looking to break out from a key structure zone near $0.26, which could cause a change in market momentum. This technical outlook comes amidst a bearish week for DOGE, which has seen it breaking below support levels and erasing its gains throughout January. According to a technical analysis of […]
placeholder
XRP Price Finds Stability—Can It Turn Higher from Here?XRP price is moving higher from the $2.320 support zone. The price must clear the $2.50 and $2.52 levels to start a fresh increase in the near term. XRP price started a decent upward move from the
Author  NewsBTC
7 hours ago
XRP price is moving higher from the $2.320 support zone. The price must clear the $2.50 and $2.52 levels to start a fresh increase in the near term. XRP price started a decent upward move from the
Related Instrument
goTop
quote