NZD/JPY Price Analysis: Pair stumbles below 100-day SMA, leaving rally in doubt

Source Fxstreet
  • NZD/JPY slips on Wednesday, hovering around 88.75 after failing to overcome a mid-week ceiling.
  • RSI dips to 53 in positive territory, signaling a sudden loss of bullish momentum.
  • MACD histogram shows flat green bars, hinting that the recent upside may be running out of steam.

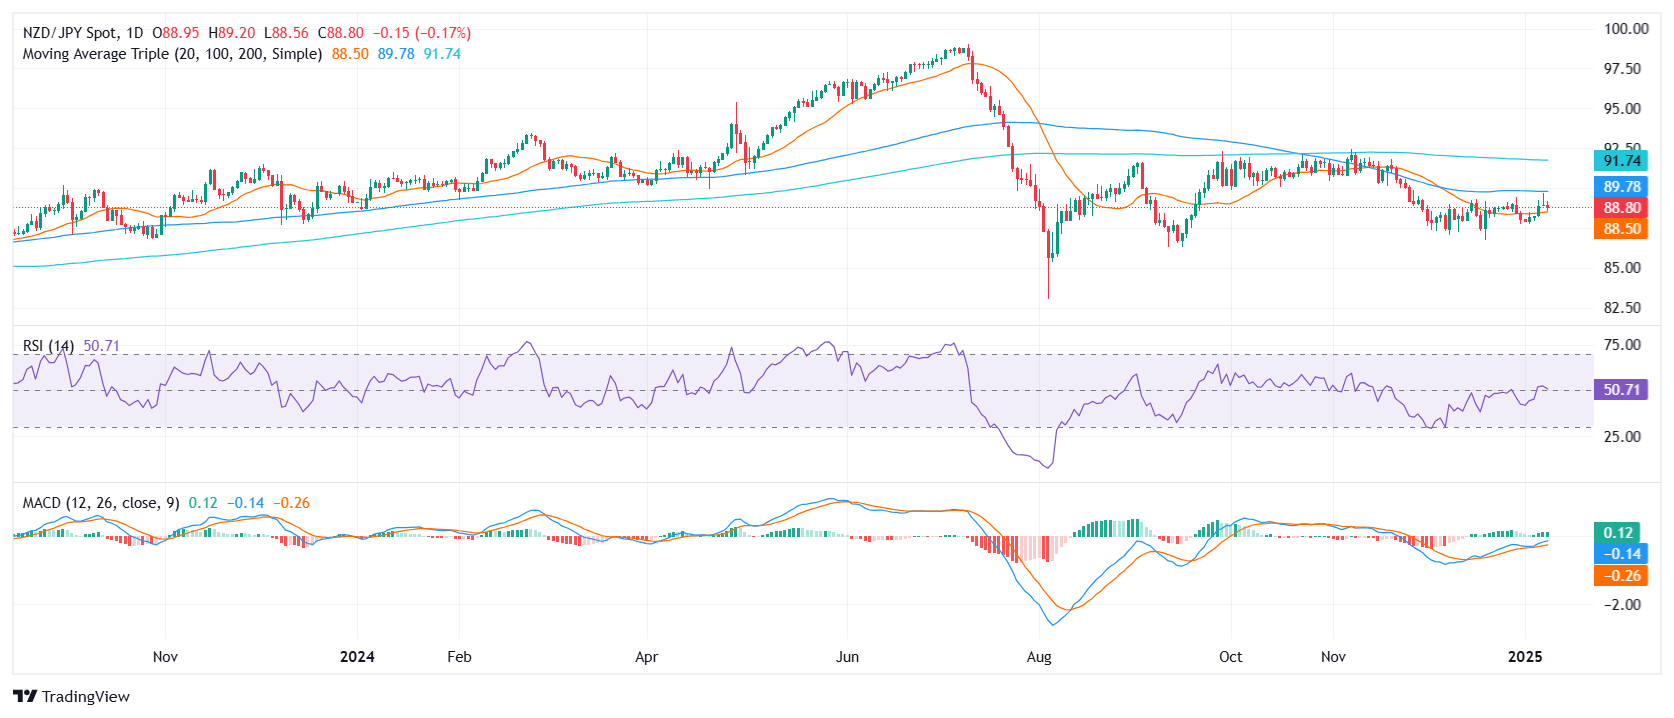
NZD/JPY retreated on Wednesday, declining by 0.33% to settle near 88.75. Earlier attempts to break above the 100-day Simple Moving Average (SMA) near 90.00 faltered, curbing the pair’s recent rebound. The Relative Strength Index (RSI) has pulled back to 53, indicating fading buying interest, while the Moving Average Convergence Divergence (MACD) histogram remains flat, suggesting limited follow-through on the upside push.

Should the bulls continue to struggle at the 100-day SMA, the pair may face additional downside pressure. Immediate support levels could appear around 88.50, with a deeper drop targeting 88.00 if selling accelerates. Conversely, a clean break above the 100-day SMA might reignite bullish momentum, paving the way toward the 89.50 zone before encountering potential psychological resistance at 90.00.

NZD/JPY daily chart
 

Disclaimer: For information purposes only. Past performance is not indicative of future results.
placeholder
Why Did The S&P 500 And Nasdaq Composite Just Fall Over 1%?TradingKey - The year 2025 started off on a pretty solid footing for investors with the key indices in the US – the S&P 500 Index and the tech-focused Nasdaq Composite Index – both posting gains in the first few days of trading. That followed on from some huge double-digit gains for 2023 and 2024.
Author  TradingKey
Yesterday 05: 27
TradingKey - The year 2025 started off on a pretty solid footing for investors with the key indices in the US – the S&P 500 Index and the tech-focused Nasdaq Composite Index – both posting gains in the first few days of trading. That followed on from some huge double-digit gains for 2023 and 2024.
placeholder
XRP Price Eyes Bullish Flag Breakout That Could Put 50% Gains On The BoardDespite recent declines and volatility, a crypto analyst has declared that the XRP price is on the cusp of breaking out of a bullish flag pattern. According to the analyst, a successful breakout of
Author  NewsBTC
10 hours ago
Despite recent declines and volatility, a crypto analyst has declared that the XRP price is on the cusp of breaking out of a bullish flag pattern. According to the analyst, a successful breakout of
placeholder
Australian Dollar remains subdued following China's inflation reportThe Australian Dollar (AUD) extends its losses for the third consecutive day against the US Dollar (USD), with the AUD/USD pair holding losses following mixed economic data released on Thursday.
Author  FXStreet
9 hours ago
The Australian Dollar (AUD) extends its losses for the third consecutive day against the US Dollar (USD), with the AUD/USD pair holding losses following mixed economic data released on Thursday.
placeholder
XRP Price vs. BTC Pressure: Can It Hold Its Ground?XRP price is holding the ground above $2.25 despite pressure on Bitcoin. The price is now consolidating and aiming for a fresh increase above the $2.40 resistance. XRP price is showing a few positive
Author  NewsBTC
6 hours ago
XRP price is holding the ground above $2.25 despite pressure on Bitcoin. The price is now consolidating and aiming for a fresh increase above the $2.40 resistance. XRP price is showing a few positive
placeholder
XRP Price Rises Against the Tide! Ripple President Hints at Spot ETF ApprovalWhile the broader cryptocurrency market faced a pullback amid expectations of slower interest rate cuts by the Federal Reserve, XRP defied the trend, surging nearly 3% on Thursday, January 9.
Author  TradingKey
5 hours ago
While the broader cryptocurrency market faced a pullback amid expectations of slower interest rate cuts by the Federal Reserve, XRP defied the trend, surging nearly 3% on Thursday, January 9.
Related Instrument
goTop
quote