EUR/USD Price Analysis: Pair slides below 1.0300, indicators lose steam

Source Fxstreet
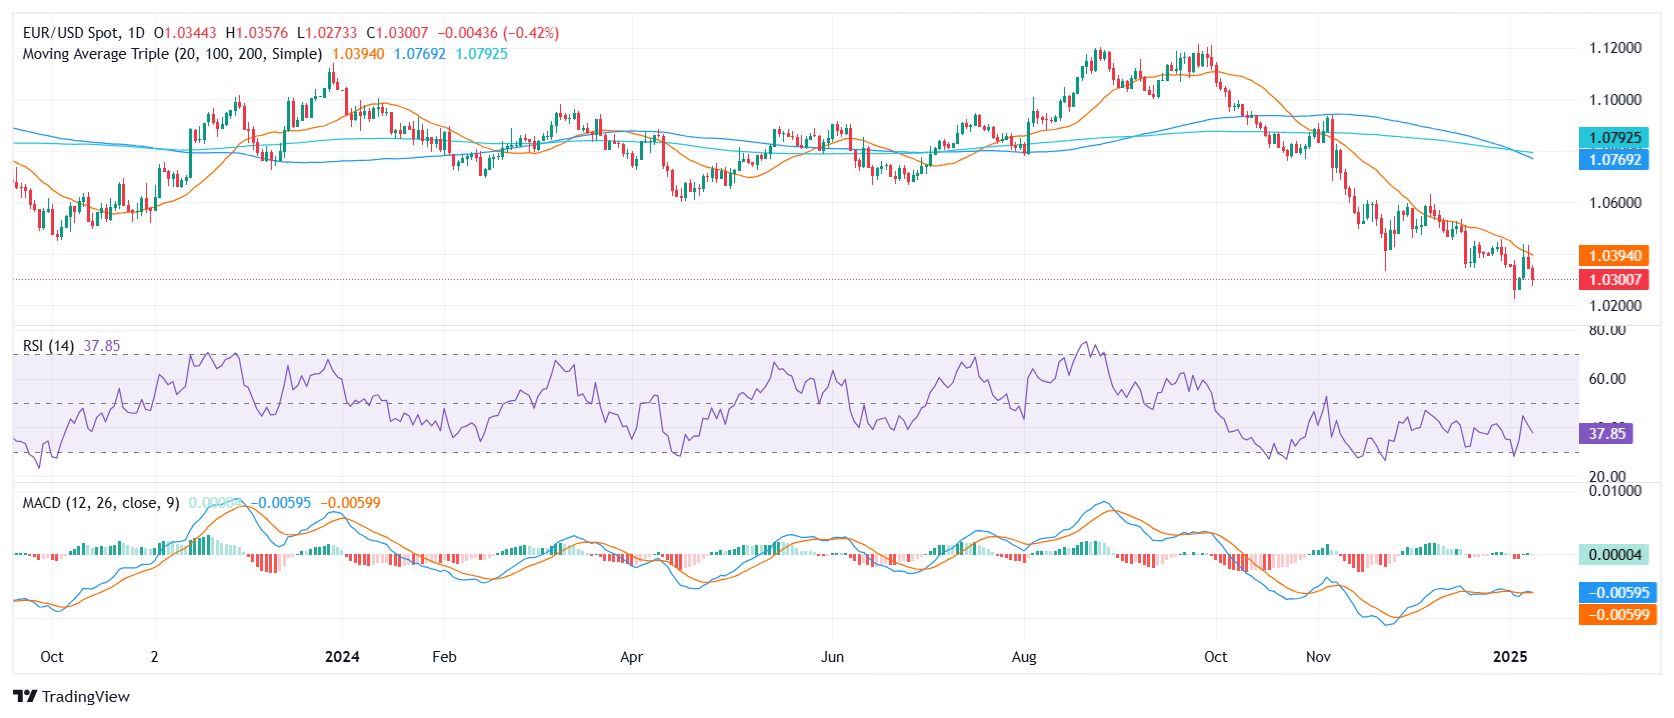
  • EUR/USD declines by 0.48% on Wednesday, settling near 1.0295 after failing to break above the 20-day SMA.
  • RSI falls sharply to 39 in negative territory, revealing intensified selling pressure.
  • MACD histogram prints decreasing green bars, suggesting waning bullish momentum and a renewed downside tilt.

EUR/USD struggled on Wednesday, shedding 0.48% to trade around 1.0295. This latest drop underscores the pair’s inability to sustain any meaningful recovery, as multiple attempts to breach the 20-day Simple Moving Average (SMA) since early 2025 have been met with forceful selling. As a result, bullish momentum appears to be receding, leaving sellers firmly in control of the near-term price action.

Technical readings paint a downbeat picture. The Relative Strength Index (RSI) has dropped to 39, reinforcing the notion that downward pressure is picking up pace. Meanwhile, the Moving Average Convergence Divergence (MACD) histogram shows a decline in green bars, hinting that any previous efforts by buyers have begun to fade. Despite these setbacks, a definitive move above the 20-day SMA would still represent the clearest signal of a reversal, should buyers regroup and attempt another push higher.

Until that materializes, however, the path of least resistance remains tilted to the downside. Traders will keep a close watch on incoming macro catalysts and price action around the 20-day SMA for early signs of a possible turnaround.

EUR/USD daily chart
Disclaimer: For information purposes only. Past performance is not indicative of future results.
placeholder
Japanese Yen hangs near multi-month low against USD; seems vulnerableThe Japanese Yen (JPY) languishes near a six-month low against its American counterpart and seems vulnerable to prolonging a one-month-old downtrend amid uncertainty about the timing of the next rate hike by the Bank of Japan (BoJ).
Author  FXStreet
Yesterday 02: 24
The Japanese Yen (JPY) languishes near a six-month low against its American counterpart and seems vulnerable to prolonging a one-month-old downtrend amid uncertainty about the timing of the next rate hike by the Bank of Japan (BoJ).
placeholder
Why Did The S&P 500 And Nasdaq Composite Just Fall Over 1%?TradingKey - The year 2025 started off on a pretty solid footing for investors with the key indices in the US – the S&P 500 Index and the tech-focused Nasdaq Composite Index – both posting gains in the first few days of trading. That followed on from some huge double-digit gains for 2023 and 2024.
Author  TradingKey
Yesterday 05: 27
TradingKey - The year 2025 started off on a pretty solid footing for investors with the key indices in the US – the S&P 500 Index and the tech-focused Nasdaq Composite Index – both posting gains in the first few days of trading. That followed on from some huge double-digit gains for 2023 and 2024.
placeholder
Open interest in Bitcoin futures contracts on CME is now at a record 51,000The Kobeissi Letter reported that Open Interest in Bitcoin futures contracts on the CME hit a record of 51,000. According to the market analyst, CME's surge in open interest in Bitcoin futures coincided with the launch of spot Bitcoin ETFs last year. 
Author  Cryptopolitan
5 hours ago
The Kobeissi Letter reported that Open Interest in Bitcoin futures contracts on the CME hit a record of 51,000. According to the market analyst, CME's surge in open interest in Bitcoin futures coincided with the launch of spot Bitcoin ETFs last year. 
placeholder
XRP Price Eyes Bullish Flag Breakout That Could Put 50% Gains On The BoardDespite recent declines and volatility, a crypto analyst has declared that the XRP price is on the cusp of breaking out of a bullish flag pattern. According to the analyst, a successful breakout of
Author  NewsBTC
5 hours ago
Despite recent declines and volatility, a crypto analyst has declared that the XRP price is on the cusp of breaking out of a bullish flag pattern. According to the analyst, a successful breakout of
placeholder
Has Bitcoin topped for the cycle? Here's what key metrics suggestBitcoin (BTC) experienced a 2% decline on Wednesday as the cryptocurrency market grapples with recent losses.
Author  FXStreet
5 hours ago
Bitcoin (BTC) experienced a 2% decline on Wednesday as the cryptocurrency market grapples with recent losses.
Related Instrument
goTop
quote