


GBP/USD Price Forecast: Tests descending channel’s upper boundary above 1.2650
- GBP/USD may gain ground due to the potential for an upward momentum shift.
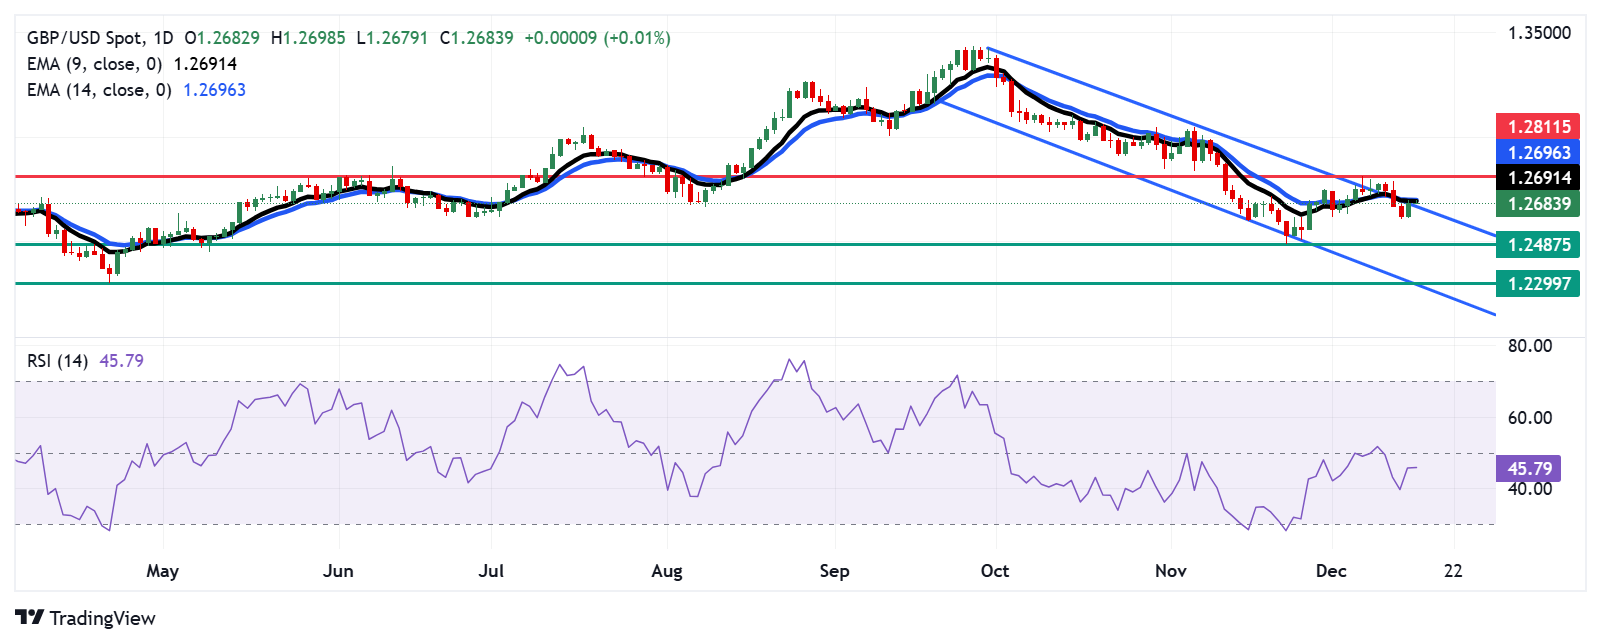
- The pair tests the upper boundary of the descending channel aligned with the nine-day EMA at 1.2691 level.
- The initial support appears at its four-week low of 1.2487.
GBP/USD remains flat following gains in the previous session, trading around 1.2680 during the Asian hours on Tuesday. The daily chart analysis suggests a upward momentum shift as the pair attempts to break above the descending channel pattern, aligned with nine- and 14-day Exponential Moving Averages (EMAs).
However, the 14-day Relative Strength Index (RSI) remains below the 50 level, suggesting a bearish bias is still in play. A decisive surpass of the 50 mark would give confirmation of an emergence of bullish sentiment.
The GBP/USD pair is testing its initial resistance near the descending channel's upper boundary, which aligns with the nine-day EMA at 1.2691. A decisive break above this key level could reinforce the bullish bias, paving the way for a move toward the five-week high of 1.2811, marked on December 6.
On the downside, the pair faces support around the four-week low of 1.2487, recorded on November 22. A break below this level could amplify bearish momentum, potentially driving the pair toward the lower boundary of the descending channel and its yearly low at 1.2299, last seen on April 22.
GBP/USD: Daily Chart
British Pound PRICE Today
The table below shows the percentage change of British Pound (GBP) against listed major currencies today. British Pound was the strongest against the New Zealand Dollar.
| USD | EUR | GBP | JPY | CAD | AUD | NZD | CHF | |
|---|---|---|---|---|---|---|---|---|
| USD | -0.03% | -0.00% | -0.08% | 0.04% | 0.11% | 0.12% | 0.06% | |
| EUR | 0.03% | 0.03% | -0.08% | 0.07% | 0.14% | 0.14% | 0.09% | |
| GBP | 0.00% | -0.03% | -0.08% | 0.05% | 0.11% | 0.11% | 0.08% | |
| JPY | 0.08% | 0.08% | 0.08% | 0.12% | 0.19% | 0.18% | 0.16% | |
| CAD | -0.04% | -0.07% | -0.05% | -0.12% | 0.07% | 0.08% | 0.04% | |
| AUD | -0.11% | -0.14% | -0.11% | -0.19% | -0.07% | 0.00% | -0.05% | |
| NZD | -0.12% | -0.14% | -0.11% | -0.18% | -0.08% | -0.00% | -0.04% | |
| CHF | -0.06% | -0.09% | -0.08% | -0.16% | -0.04% | 0.05% | 0.04% |
The heat map shows percentage changes of major currencies against each other. The base currency is picked from the left column, while the quote currency is picked from the top row. For example, if you pick the British Pound from the left column and move along the horizontal line to the US Dollar, the percentage change displayed in the box will represent GBP (base)/USD (quote).
Recommended Articles


