GBP/USD Price Forecast: Hovers below 1.2650, descending channel’s upper boundary

Source Fxstreet
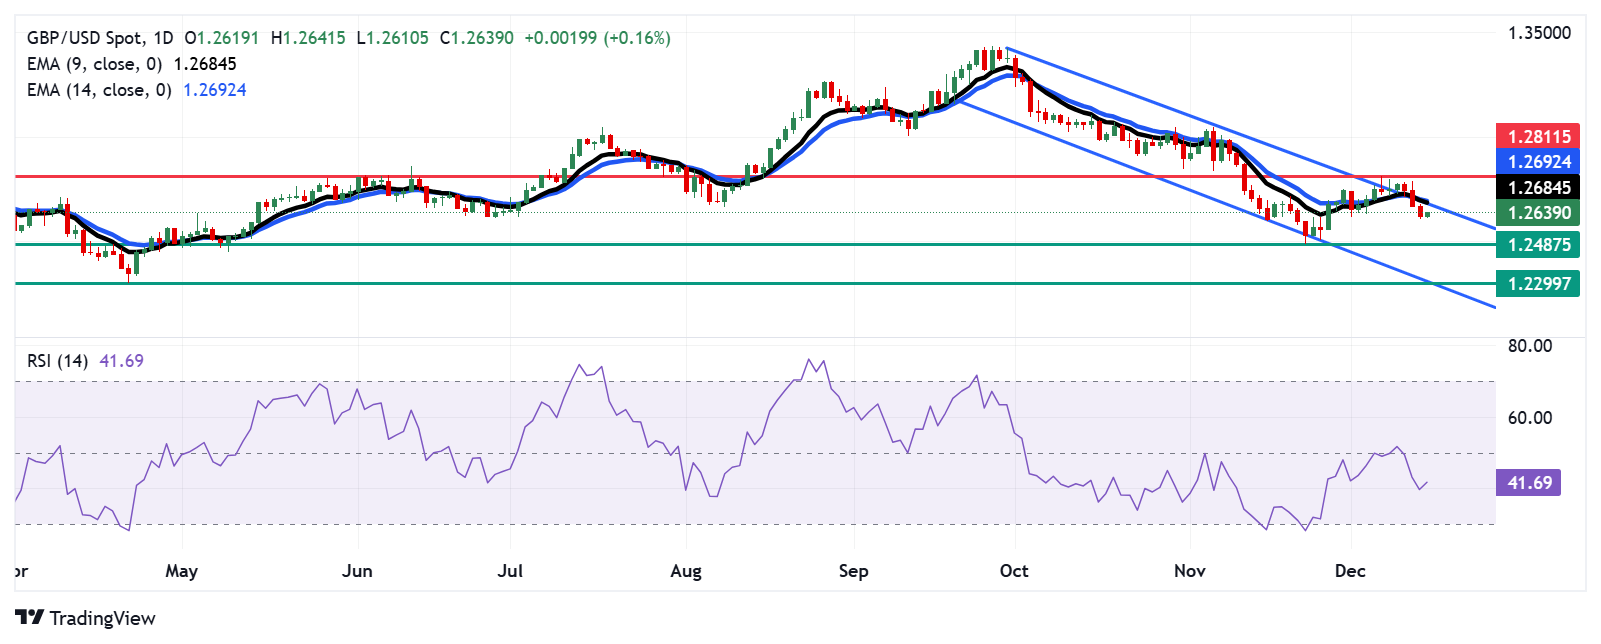
  • GBP/USD remains below the descending channel’s upper boundary, aligned with the nine-day EMA at 1.2684 level.
  • The bearish sentiment prevails as the 14-day RSI remains below the 50 mark.
  • The primary support appears at the four-week low of 1.2487.

GBP/USD breaks its three-day losing streak, trading around 1.2640 during the early European hours on Monday. The daily chart analysis shows an ongoing bearish bias as the pair is confined within the descending channel pattern.

The 14-day Relative Strength Index (RSI) is positioned below the 50 level, strengthening the bearish sentiment. Additionally, the GBP/USD pair falls below the nine- and 14-day Exponential Moving Average (EMA), which indicates that the short-term price momentum is weaker, signaling the potential for continued price weakness.

On the downside, the GBP/USD pair may navigate the region around its four-week low of 1.2487, which was recorded on November 22. A break below this level could strengthen the bearish bias and put downward pressure on the pair to approach the lower boundary of the descending channel, aligned with its yearly low at 1.2299, reached on April 22.

The GBP/USD pair may find initial resistance around the descending channel’s upper boundary, aligned with the nine-day EMA at the 1.2684 level. A break above this level could weaken the bearish sentiment and support the pair to explore the area around its five-week high of 1.2811 level, marked on December 6.

GBP/USD: Daily Chart
British Pound PRICE Today

The table below shows the percentage change of British Pound (GBP) against listed major currencies today. British Pound was the strongest against the US Dollar.

  USD EUR GBP JPY CAD AUD NZD CHF
USD   -0.12% -0.14% -0.09% -0.06% -0.18% -0.26% -0.28%
EUR 0.12%   0.04% 0.13% 0.13% 0.12% -0.05% -0.10%
GBP 0.14% -0.04%   -0.04% 0.09% 0.08% -0.12% -0.14%
JPY 0.09% -0.13% 0.04%   0.02% -0.07% -0.14% -0.10%
CAD 0.06% -0.13% -0.09% -0.02%   -0.07% -0.21% -0.23%
AUD 0.18% -0.12% -0.08% 0.07% 0.07%   -0.17% -0.22%
NZD 0.26% 0.05% 0.12% 0.14% 0.21% 0.17%   -0.04%
CHF 0.28% 0.10% 0.14% 0.10% 0.23% 0.22% 0.04%  

The heat map shows percentage changes of major currencies against each other. The base currency is picked from the left column, while the quote currency is picked from the top row. For example, if you pick the British Pound from the left column and move along the horizontal line to the US Dollar, the percentage change displayed in the box will represent GBP (base)/USD (quote).

Disclaimer: For information purposes only. Past performance is not indicative of future results.
placeholder
Solana Investors Double Down: New Long-Term Holders Signal Confidence In 2024 Rally ContinuationSolana’s investor base is demonstrating unwavering confidence as the network sees a shift in the profile of its long-term holders. According to on-chain data from Glassnode, many more Solana addresses are moving into the long-term holder base, which showcases strong conviction from investors who entered the market during the recent 2024 rally.
Author  Bitcoinist
8 hours ago
Solana’s investor base is demonstrating unwavering confidence as the network sees a shift in the profile of its long-term holders. According to on-chain data from Glassnode, many more Solana addresses are moving into the long-term holder base, which showcases strong conviction from investors who entered the market during the recent 2024 rally.
placeholder
Ethereum Forming A Symmetrical Pattern – Key Resistance At $4,100Ethereum is making another attempt to break above the $4,000 level as it edges closer to its all-time highs. Despite its strong fundamentals, doubts linger in the market regarding Ethereum’s performance this cycle, with some expecting it to underperform amid stiff competition from other blockchain ecosystems. However, Ethereum’s recent price action suggests that it is building momentum, keeping investors on edge for a potential breakout.
Author  NewsBTC
8 hours ago
Ethereum is making another attempt to break above the $4,000 level as it edges closer to its all-time highs. Despite its strong fundamentals, doubts linger in the market regarding Ethereum’s performance this cycle, with some expecting it to underperform amid stiff competition from other blockchain ecosystems. However, Ethereum’s recent price action suggests that it is building momentum, keeping investors on edge for a potential breakout.
placeholder
Bitcoin has a twisted relationship with the most powerful men on Wall StreetBitcoin, which faced heavy criticism from Wall Street heads during the early years, has become a $2 trillion beast, punching its way past $103,000 for the first time after 15 years of chaos.
Author  Cryptopolitan
8 hours ago
Bitcoin, which faced heavy criticism from Wall Street heads during the early years, has become a $2 trillion beast, punching its way past $103,000 for the first time after 15 years of chaos.
placeholder
Solana (SOL) Faces Headwinds: Can Bulls Revive Momentum?If SOL fails to rise above the $228 resistance, it could start another decline.
Author  NewsBTC
3 hours ago
If SOL fails to rise above the $228 resistance, it could start another decline.
placeholder
Bitcoin breaks all-time high above $106,000, triggers nearly $120 million in liquidationsBitcoin breaks its previous all-time high on Monday, reaches a high of $106,648.
Author  FXStreet
3 hours ago
Bitcoin breaks its previous all-time high on Monday, reaches a high of $106,648.
Related Instrument
goTop
quote