NZD/USD Price Analysis: Bulls falter after breaking 20-day SMA, bullish thesis at risk
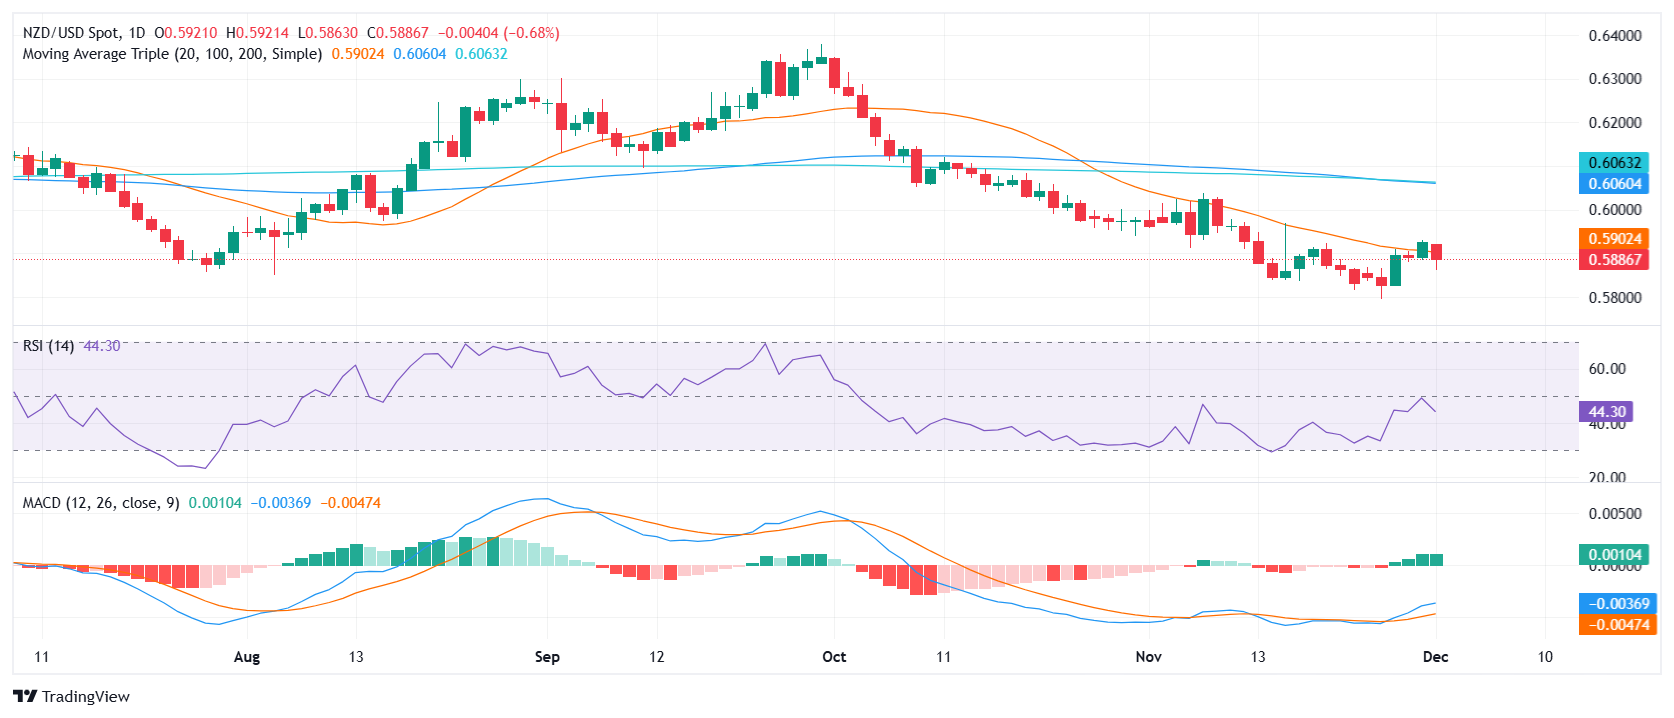
- NZD/USD sank by 0.69% on Monday to trade near 0.5885.
- Bulls failed to secure the 20-day SMA after breaking above it, risking the bullish bias.
- Indicators took a step back and might continue losing ground if they do not secure the 20-day SMA.
The NZD/USD pair extended its weakness from a fresh monthly high recorded in the previous week. In Monday's session, the NZD/USD declined by 0.69% to 0.5885. Bulls failed to secure the 20-day Simple Moving Average (SMA) after breaking above it, risking the bullish bias.
Technical analysis of the NZD/USD pair indicates a sideways range, with the Relative Strength Index (RSI) at 46, suggesting rising selling pressure, while the Moving Average Convergence Divergence (MACD) is flat and green, indicating flat buying pressure. Overall, the outlook is mixed, with support levels at 0.5850, 0.5800, and 0.5750, and resistance levels at 0.5900, 0.5950, and 0.6000.
Technical indicators for the NZD/USD pair have taken a step back, signaling a potential shift in momentum. While the pair remains within a range, the failure of bulls to hold above the 20-day SMA poses a risk to the bullish bias. Traders should monitor the mentioned levels as a loss of the 0.5850 area could indicate a continuation of the downtrend.
NZD/USD daily chart


