


GBP/USD Price Forecast: Slips below 1.2700 amid buoyant US Dollar
- GBP/USD declines over 0.50%, with sellers targeting further lows after breaking past 1.2644.
- Bearish momentum confirmed by RSI; GBP faces key supports at 1.2600 and 1.2486.
- Potential recovery hinges on surpassing resistance at 1.2700 and 1.2818 (200-day SMA).
The Pound Sterling tumbled over 0.50% against the Greenback on Monday, as the latter recovered from last week’s losses, remaining bid on Monday. At the time of writing, the GBP/USD trades at 1.2659, dropping after reaching a daily high of 1.2735.
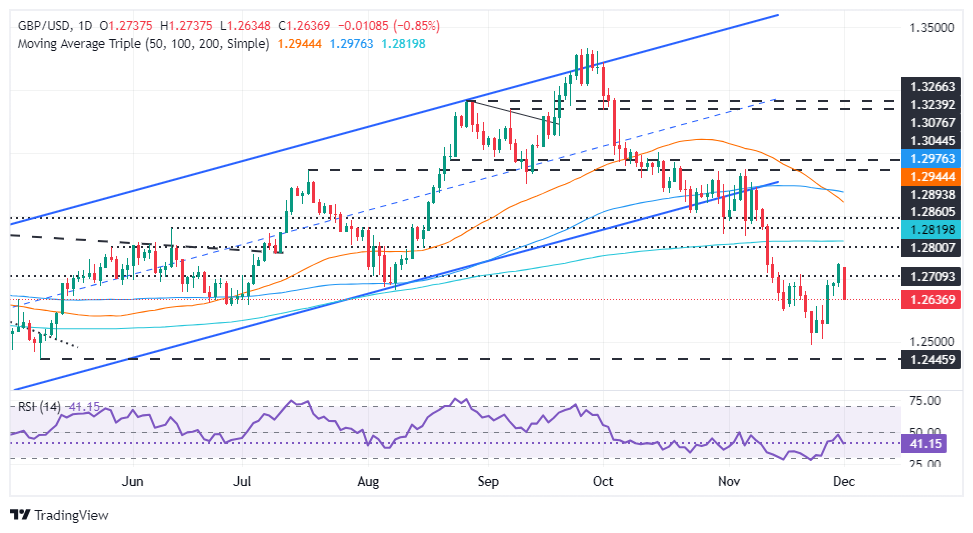
GBP/USD Price Forecast: Technical outlook
The GBP/USD downtrend remains intact, and it could be threatened if buyers clear the 200-day Simple Moving Average (SMA) at 1.2818. Sellers must clear the November 28 daily low of 1.2644 before extending their drop to 1.2600. A breach of the latter will expose the latest major support at 1.2486, the November 22 swing low, followed by the current year’s low of 1.2299.
Conversely, if GBP/USD clears the 1.2700 figure, the first resistance would be the 1.2800 figure, followed by the 200-day SMA at 1.2818. Once those two levels are surpassed, it would emerge 1.2900 and the 50-day SMA as next key resistance at 1.2943.
The momentum remains bearish, as depicted by the Relative Strength Index (RSI), which aims to be lower at the beginning of December.
GBP/USD Price Chart – Daily
British Pound PRICE Today
The table below shows the percentage change of British Pound (GBP) against listed major currencies today. British Pound was the strongest against the Australian Dollar.
| USD | EUR | GBP | JPY | CAD | AUD | NZD | CHF | |
|---|---|---|---|---|---|---|---|---|
| USD | 0.94% | 0.81% | 0.16% | 0.58% | 0.93% | 0.90% | 0.79% | |
| EUR | -0.94% | -0.17% | -0.77% | -0.34% | 0.08% | -0.03% | -0.13% | |
| GBP | -0.81% | 0.17% | -0.63% | -0.17% | 0.25% | 0.15% | 0.02% | |
| JPY | -0.16% | 0.77% | 0.63% | 0.43% | 0.81% | 0.77% | 0.57% | |
| CAD | -0.58% | 0.34% | 0.17% | -0.43% | 0.50% | 0.32% | 0.19% | |
| AUD | -0.93% | -0.08% | -0.25% | -0.81% | -0.50% | -0.11% | -0.27% | |
| NZD | -0.90% | 0.03% | -0.15% | -0.77% | -0.32% | 0.11% | -0.11% | |
| CHF | -0.79% | 0.13% | -0.02% | -0.57% | -0.19% | 0.27% | 0.11% |
The heat map shows percentage changes of major currencies against each other. The base currency is picked from the left column, while the quote currency is picked from the top row. For example, if you pick the British Pound from the left column and move along the horizontal line to the US Dollar, the percentage change displayed in the box will represent GBP (base)/USD (quote).
Recommended Articles


