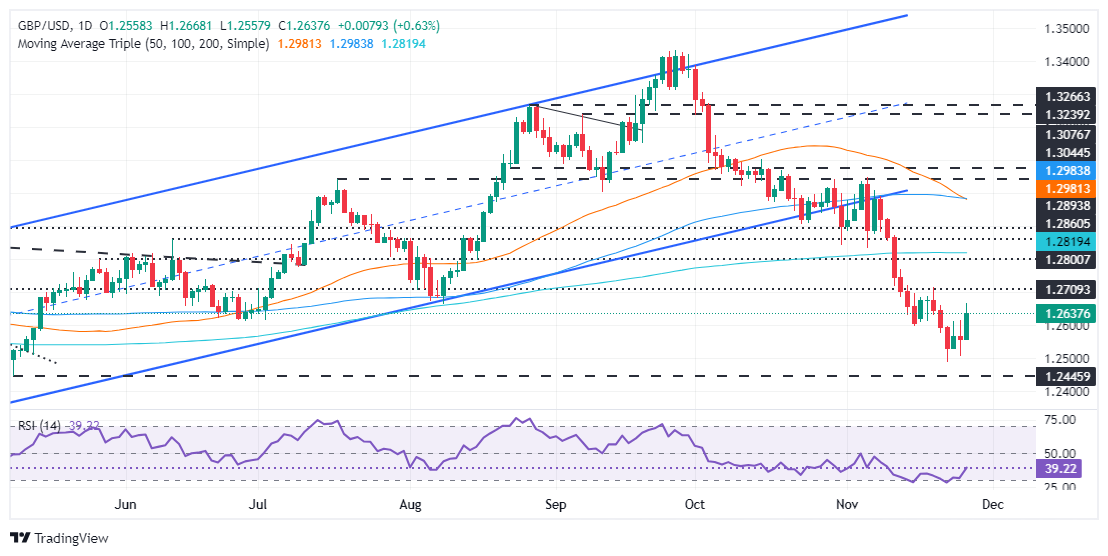
GBP/USD Price Forecast: Surges to four-day peak, above 1.2600
- GBP/USD rallies to a four-day high of 1.2667, trading at 1.2646 at the time of writing, up 0.64% daily.
- Bulls need to reclaim 1.2700 to target the 200-day SMA at 1.2818, while a break above could shift the bias upward.
- On the downside, a move below 1.2600 could see the pair test the November 22 low of 1.2486, with further support at the year-to-date low of 1.2299.
The Pound Sterling rallied to a four-day peak against the US Dollar at 1.2667 as market participants shrugged off Trump’s tariffs threats, which sparked a flight to safety on Tuesday. At the time of writing, the GBP/USD trades at 1.2646, above its opening price by 0.64%.
GBP/USD Price Forecast: Technical outlook
The GBP/USD remains biased downward despite recovering the psychological figure of 1.2600. Bulls must reclaim 1.2700 to test the 200-day Simple Moving Average (SMA) at 1.2818. If those levels are cleared, the bias could shift upwards.
For a bearish continuation, if GBP/USD drops below 1.2600, bears could drive the exchange rate toward the November 22 swing low of 1.2486. A breach of the latter will expose the year-to-date (YTD) low of 1.2299.
Oscillators such as the Relative Strength Index (RSI) signals buyers’ recovery. However, bears remain in charge as the RSI remains below the neutral line.
GBP/USD Price Chart – Daily

British Pound PRICE Today
The table below shows the percentage change of British Pound (GBP) against listed major currencies today. British Pound was the strongest against the US Dollar.
| USD | EUR | GBP | JPY | CAD | AUD | NZD | CHF | |
|---|---|---|---|---|---|---|---|---|
| USD | -0.53% | -0.61% | -1.00% | -0.14% | -0.36% | -1.16% | -0.41% | |
| EUR | 0.53% | -0.09% | -0.45% | 0.40% | 0.18% | -0.63% | 0.11% | |
| GBP | 0.61% | 0.09% | -0.36% | 0.48% | 0.26% | -0.55% | 0.20% | |
| JPY | 1.00% | 0.45% | 0.36% | 0.83% | 0.59% | -0.21% | 0.54% | |
| CAD | 0.14% | -0.40% | -0.48% | -0.83% | -0.23% | -1.04% | -0.28% | |
| AUD | 0.36% | -0.18% | -0.26% | -0.59% | 0.23% | -0.80% | -0.06% | |
| NZD | 1.16% | 0.63% | 0.55% | 0.21% | 1.04% | 0.80% | 0.76% | |
| CHF | 0.41% | -0.11% | -0.20% | -0.54% | 0.28% | 0.06% | -0.76% |
The heat map shows percentage changes of major currencies against each other. The base currency is picked from the left column, while the quote currency is picked from the top row. For example, if you pick the British Pound from the left column and move along the horizontal line to the US Dollar, the percentage change displayed in the box will represent GBP (base)/USD (quote).

