


NZD/JPY Price Analysis: Pair resumes downward trajectory, reaches lows since September
Source Fxstreet
- NZD/JPY fell 0.94% on Tuesday to trade near 89.20.
- The pair has tallied a four-day losing streak, now at lows since September 20.
- Technical indicators are signaling continued weakness for the pair, suggesting potential for further losses.
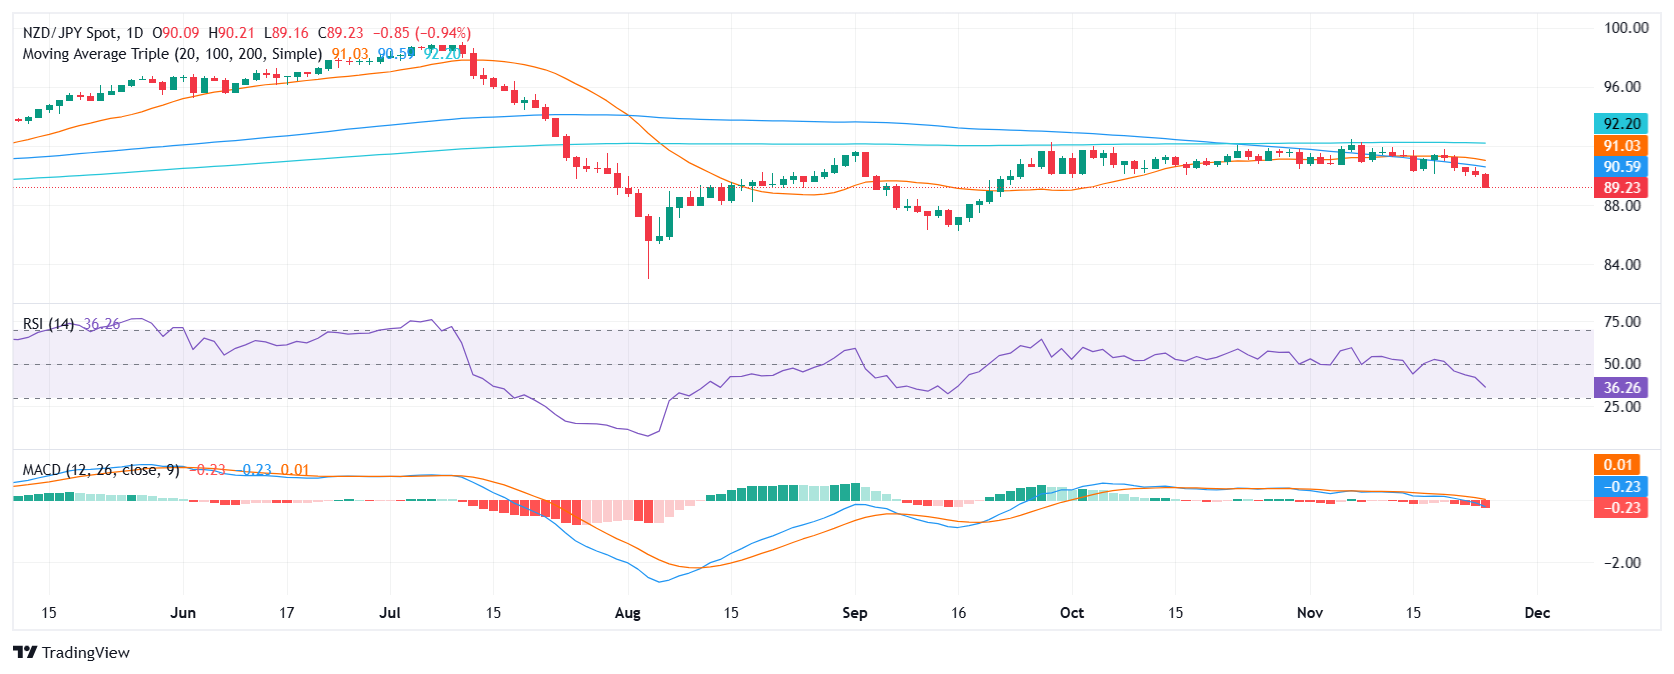
The NZD/JPY pair continued its downward trajectory on Tuesday, falling 0.94% to trade near 89.20. This marked the fourth consecutive day of losses for the pair, bringing it to its lowest level since September 20.
The pair's downtrend was further evident in the oversold the Relative Strength Index (RSI) and the Moving Average Convergence Divergence (MACD) histogram, both of which corroborated the bearish outlook. This is reinforced by the fact that the cross has broken out of the sideways trade pattern seen since late September, so the pair may see further weakness. On the bright side, there may be an upwards correction as sellers may take a breather after the losing streak, but the overall outlook remains negative.
NZD/JPY daily chart
Disclaimer: For information purposes only. Past performance is not indicative of future results.
Recommended Articles

TradingKey - Spot Silver ( XAGUSD) prices have continued to decline; on Thursday, silver plummeted as much as 20% to break below $71 per ounce, and on Friday the sell-off intensified as prices fell fu
Bitcoin is trading around $63,000, down nearly 40% from its peak near $126,000Wall Street desks are no longer talking about upside dreams. The talk right now is how far Bitcoin charts could fall if selling keeps piling up. According to data from TradingView, Bitcoin’s price now sits at a shocking $63,500, after falling from $70,000 just this morning, losing $13,000 in 6 days, and staying far below […]
Wall Street desks are no longer talking about upside dreams. The talk right now is how far Bitcoin charts could fall if selling keeps piling up. According to data from TradingView, Bitcoin’s price now sits at a shocking $63,500, after falling from $70,000 just this morning, losing $13,000 in 6 days, and staying far below […]
West Texas Intermediate (WTI), the US crude oil benchmark, is trading around $62.85 during the Asian trading hours on Friday. The WTI price declines after the United States (US) and Iran agreed to hold talks in Oman on Friday.
Bitcoin plunges 11% to break $65k as analysts term the crash "structural," citing a $1 trillion market wipeout and $2.09 billion in daily liquidations.
The U.S. government refuses to bail out Bitcoin, and with Fed rate cuts nowhere in sight, a continued downward trend to test for a bottom is likely after a brief rebound.During the mid-da
Related Instrument


