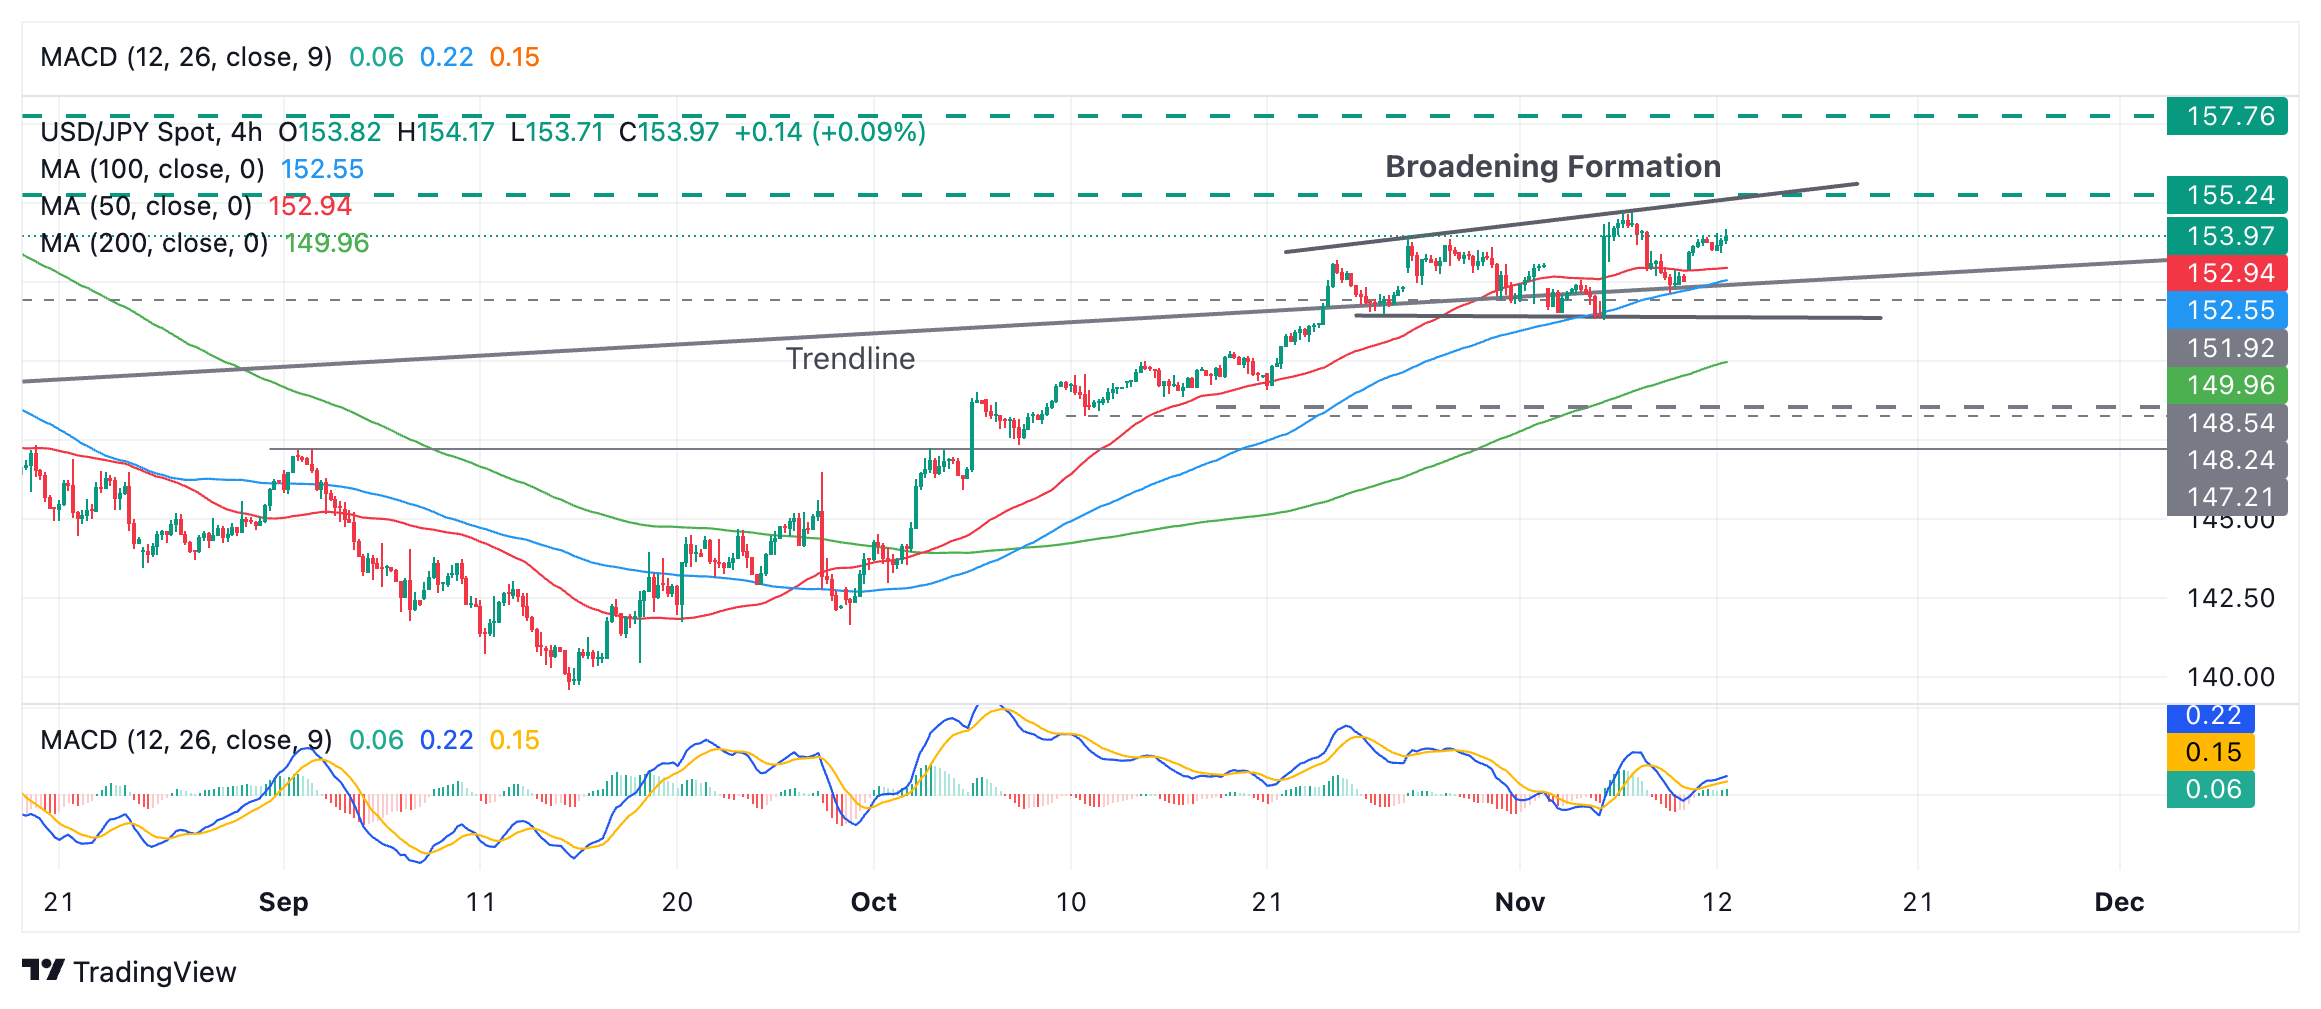
USD/JPY Price Forecast: Broadening Formation unfolding, probably bearish
- USD/JPY is probably forming a bearish Broadening Formation price pattern.
- These often occur during periods of market volatility and end with a breakout lower.
USD/JPY is probably forming a Broadening Formation price pattern which began in the last week of September.
The Broadening Formation occurs when price starts to go sideways but forms higher highs and lower lows with each leg of its unfolding. When the highs and lows of the range are connected with trendlines this creates a widening range, or price pattern.
USD/JPY 4-hour Chart

Broadening Formations usually occur during periods of high market volatility as has been the case during the formation of the one on USD/JPY which coincides with the US presidential election.
When it forms at a price top the pattern is bearish as is the case with the one on USD/JPY. Eventually price is likely to break below the lower boundary line and decline rapidly lower. The distance it is likely to go depends on how wide the pattern becomes at its broadest point.
It is difficult to determine when these patterns have concluded, however, it is worth keeping USD/JPY on a watchlist and assessing its maturity as it evolves.
The Moving Average Convergence Divergence (MACD) momentum indicator is a useful indicator for trading the up and down legs of the pattern. The blue MACD tends to be a useful indicator of turning points in price as it turns above or below its red signal line.

