EUR/JPY Price Prediction: Continues to pullback to trendline for Sept-Oct rally

Source Fxstreet
  • EUR/JPY pulls back to the trendline for the recent rally from the September lows. 
  • If it breaks higher it could kick-off an extension to a target in the 169s, MACD is bearish, however.

EUR/JPY continues its pullback to the trendline (dashed line on chart) for the September-October rally. 

The pair is in a short and medium-term uptrend which given the technical analysis maxim that “the trend is your friend” is favored to continue higher. 

EUR/JPY Daily Chart 

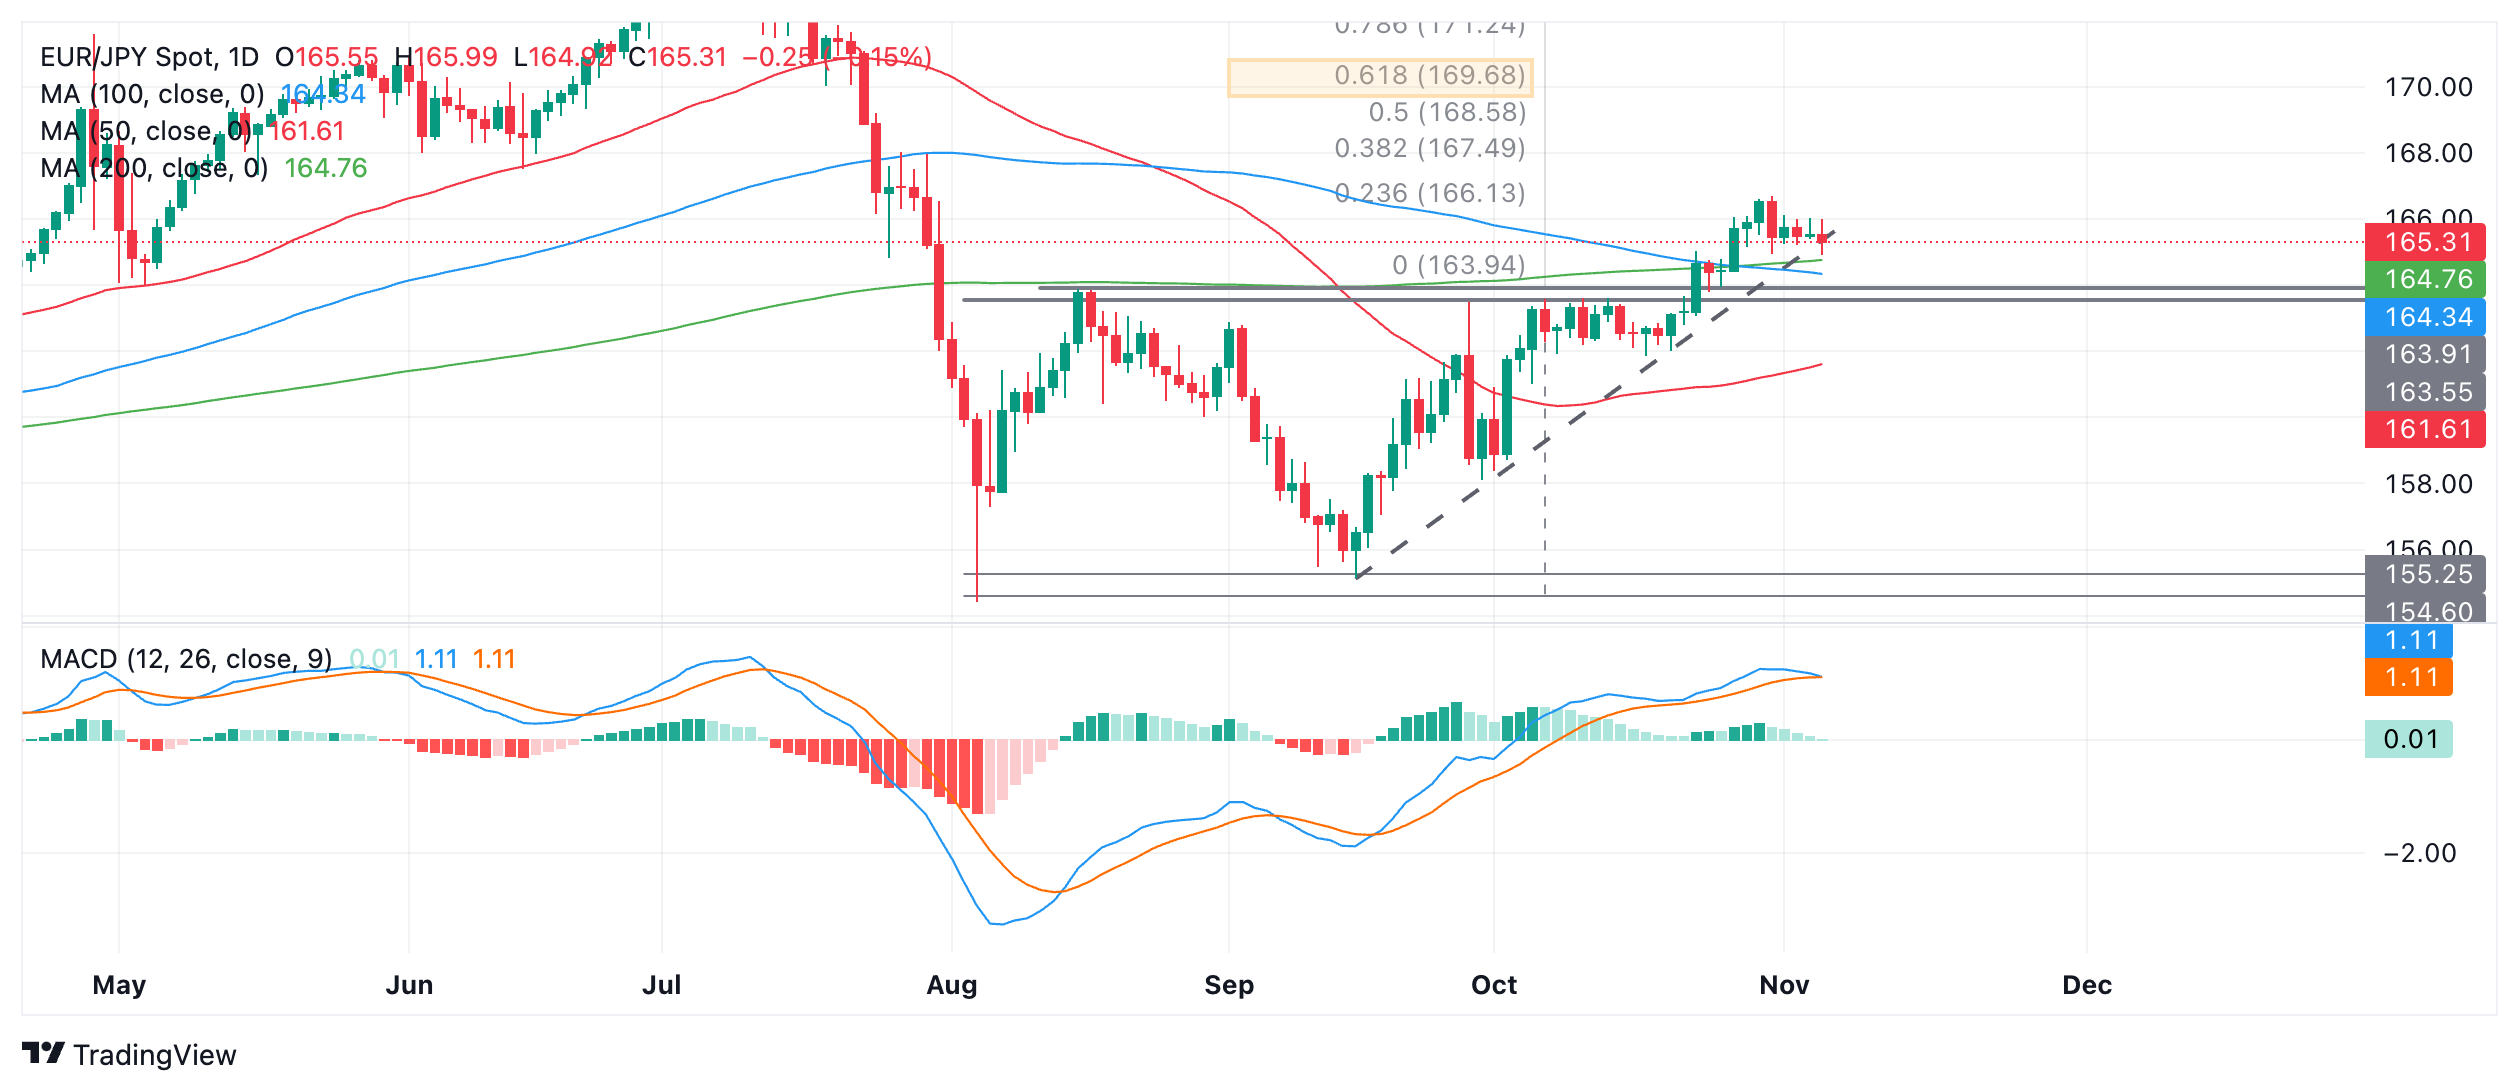
A break above 166.69 (October 31 high) would probably confirm such a continuation higher. 

Resistance at 167.96 (July 30 swing high) could provide an initial target and act as a barrier to further upside. 

The minimum target for the breakout from the range, however, lies higher, at 169.68, the 61.8% Fibonacci extrapolation of the height of the range to the upside (orange-shaded rectangle). 

The Moving Average Convergence Divergence (MACD) is threatening to cross below its signal line, however – a mildly bearish sign which could indicate further near-term weakness for the pair. 

There is also an open gap just below price which is only visible on the intraday charts at 164.90. Gaps have a habit of getting filled. If so, further weakness may be on the horizon, with price falling to the bottom of the open gap at 164.45. 


Disclaimer: For information purposes only. Past performance is not indicative of future results.
placeholder
Pi Network Price Annual Forecast: PI Heads Into a Volatile 2026 as Utility Questions Collide With Big UnlocksPi Network heads into 2026 after a 90%+ 2025 drawdown from $3.00, with 17.5 million KYC users and a smart-contract-focused Stellar v23 upgrade offering upside potential, but 1.21 billion tokens unlocking and heavy exchange deposits (437 million PI) keeping supply pressure and trust risks firmly in focus.
Author  Mitrade
Dec 19, 2025
Pi Network heads into 2026 after a 90%+ 2025 drawdown from $3.00, with 17.5 million KYC users and a smart-contract-focused Stellar v23 upgrade offering upside potential, but 1.21 billion tokens unlocking and heavy exchange deposits (437 million PI) keeping supply pressure and trust risks firmly in focus.
placeholder
ECB Policy Outlook for 2026: What It Could Mean for the Euro’s Next MoveWith the ECB likely holding rates steady at 2.15% and the Fed potentially extending cuts into 2026, EUR/USD may test 1.20 if Eurozone growth proves resilient, but weaker growth and an ECB pivot could pull the pair back toward 1.13 and potentially 1.10.
Author  Mitrade
Dec 26, 2025
With the ECB likely holding rates steady at 2.15% and the Fed potentially extending cuts into 2026, EUR/USD may test 1.20 if Eurozone growth proves resilient, but weaker growth and an ECB pivot could pull the pair back toward 1.13 and potentially 1.10.
placeholder
My Top 5 Stock Market Predictions for 2026Five 2026 market predictions written in a native, news-style voice: AI’s winners and losers, broader sector leadership, dividend demand, valuation cooling as the Shiller CAPE sits at 39 (Dec. 31, 2025), and quantum-computing bursts—while keeping all original facts and numbers unchanged.
Author  Mitrade
Jan 06, Tue
Five 2026 market predictions written in a native, news-style voice: AI’s winners and losers, broader sector leadership, dividend demand, valuation cooling as the Shiller CAPE sits at 39 (Dec. 31, 2025), and quantum-computing bursts—while keeping all original facts and numbers unchanged.
placeholder
Gold slumps to near $5,050 on oil-driven inflation fears, stronger US DollarGold price (XAU/USD) falls to around $5,065 during the early Asian session on Monday, pressured by a stronger US Dollar (USD) and inflationary risks. Traders will closely monitor the developments surrounding the US-Iran conflicts and geopolitical risks in the Middle East.
Author  FXStreet
Mar 09, Mon
Gold price (XAU/USD) falls to around $5,065 during the early Asian session on Monday, pressured by a stronger US Dollar (USD) and inflationary risks. Traders will closely monitor the developments surrounding the US-Iran conflicts and geopolitical risks in the Middle East.
placeholder
WTI recovers to near $86.50 as Strait of Hormuz remains closedWest Texas Intermediate (WTI), the US crude oil benchmark, is trading around $86.40 during the early Asian trading hours on Tuesday. The WTI price faces extreme volatility following a massive spike to nearly $120 per barrel in the previous session. 
Author  FXStreet
Mar 10, Tue
West Texas Intermediate (WTI), the US crude oil benchmark, is trading around $86.40 during the early Asian trading hours on Tuesday. The WTI price faces extreme volatility following a massive spike to nearly $120 per barrel in the previous session. 
Related Instrument
goTop
quote