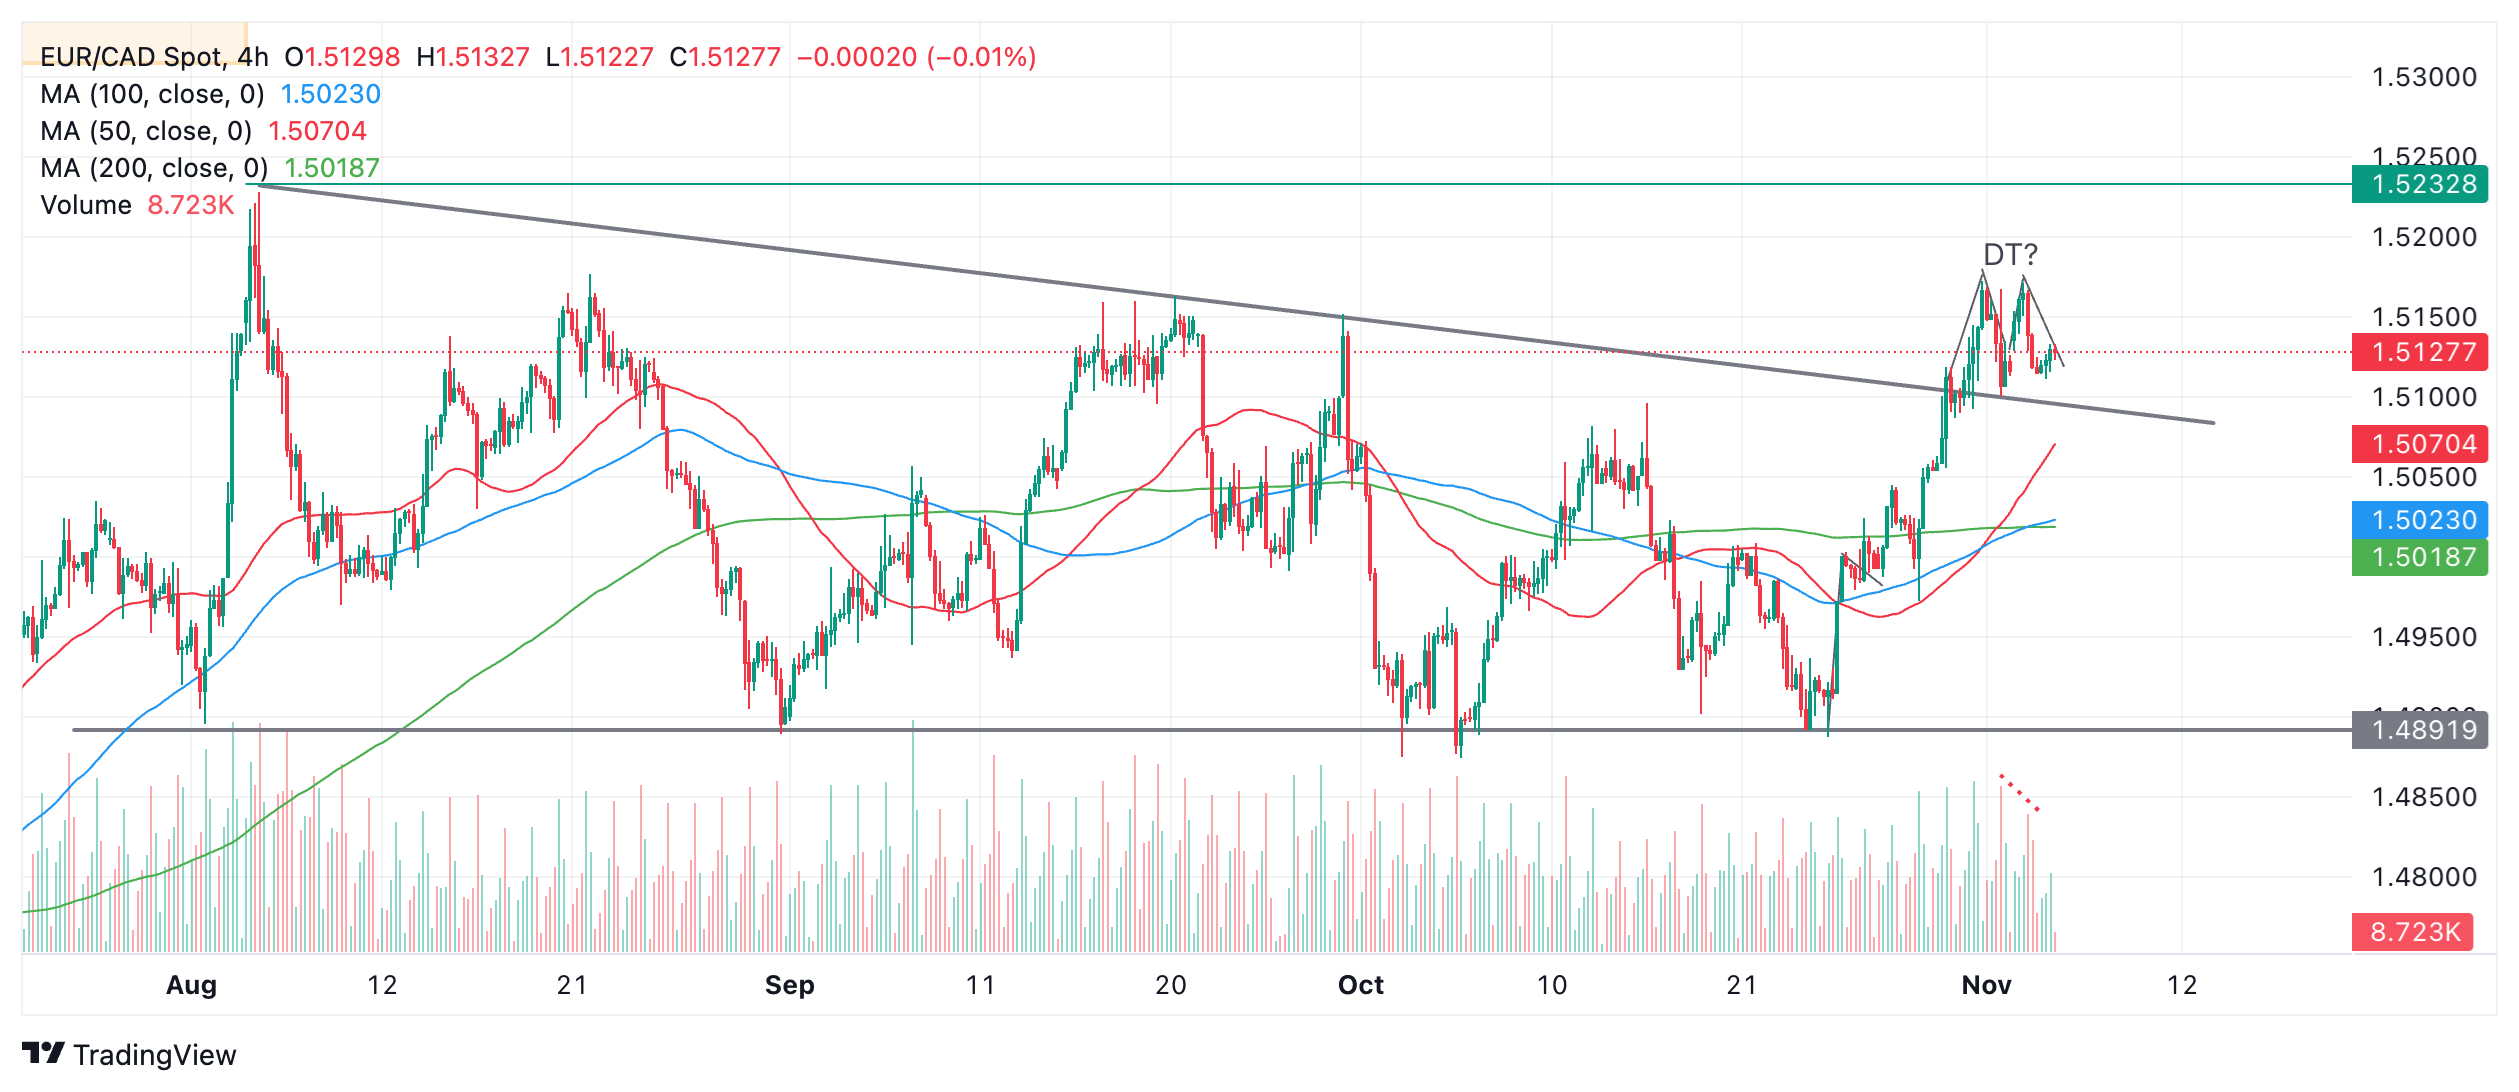
EUR/CAD Price Forecast: Two possible scenarios for EUR/CAD
- EUR/CAD could go higher after breaking out of a large multi-month consolidation.
- Alternatively, the pair might have formed a Double Top pattern and be about to fall.
EUR/CAD has two possible polar-opposite scenarios in which price could play out:
1) The pair is going higher – it has broken out from a consolidation pattern formed since August and is about to rally as it fulfills the price target for the pattern.
2) The breakout above the upper trendline of the pattern is “false” and the pair has formed a small Double Top bearish reversal pattern (DT) instead. This will likely see prices fall if price breaks below the pattern’s lows.
EUR/CAD 4-hour Chart

A break above the 1.5172 (November 1 high) would probably confirm scenario 1) and lead to a continuation higher, to an initial target at 1.5228, the August 5 high, followed by 1.5312, the 61.8% Fibonacci price projection of the height of the pattern.
A break below 1.5110 (November 1 low), on the other hand, would probably confirm the DT and lead to a move down to 1.5051 which is equal to the height of the pattern extrapolated lower.
Volume was lower on the right hand shoulder of the DT compared to the left (red dotted line on chart) which helps confirm the pattern as authentic and adds bearish color.

