NZD/JPY Price Analysis: Mixed technical outlook with sideways movement
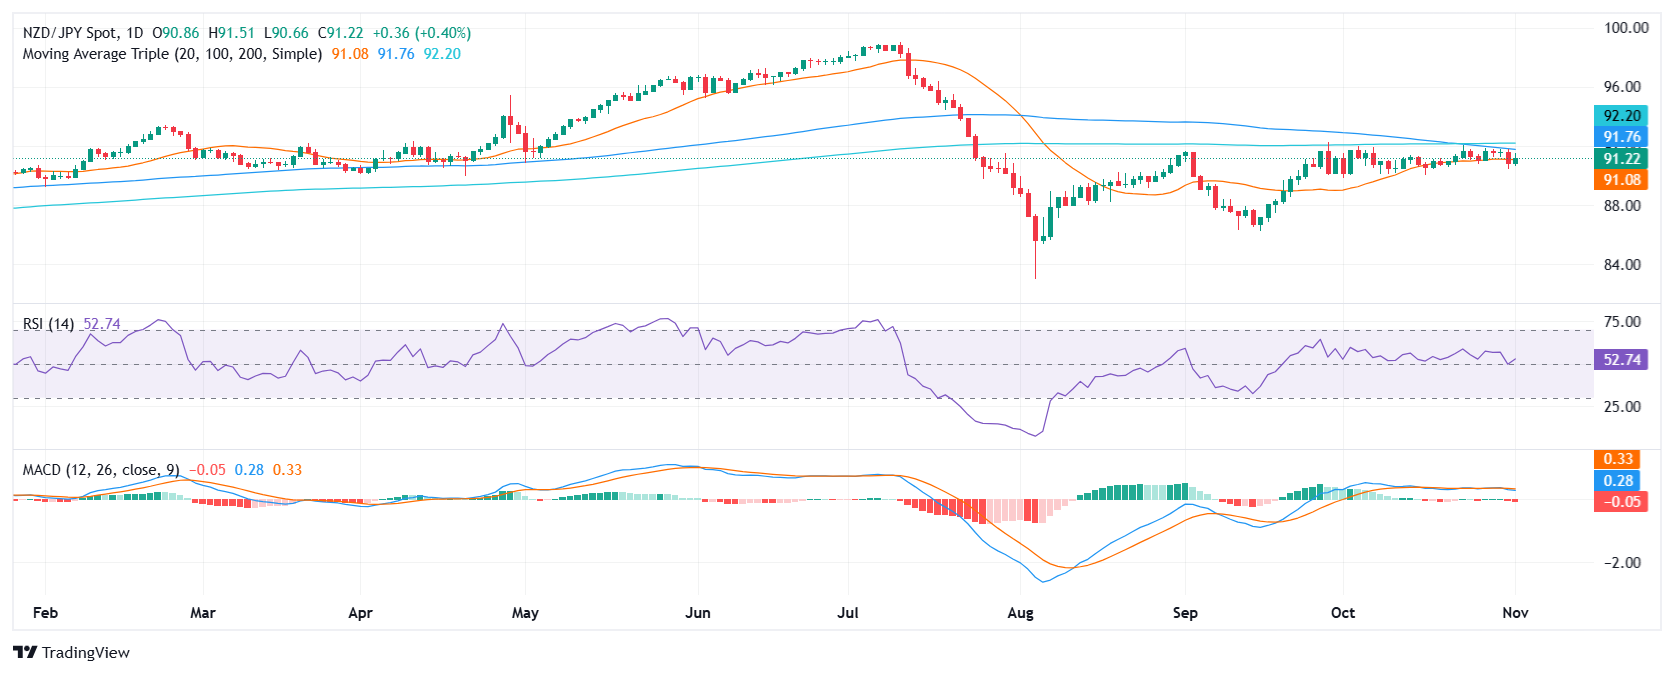
- NZD/JPY has been trading sideways recently, with mixed signals from technical indicators.
- The pair is currently supported at 90.70 and faces resistance at 91.90.
- There are some signs of bearish momentum mounting which could threaten the 20-day SMA.
Friday's trading saw the NZD/JPY pair continue its sideways movement of the past sessions. The pair exhibits a range-bound pattern with no significant upward or downward spikes. By the end of the week the cross mildly rose to 91.20, but the outlook remains neutral.
Technical indicators provide mixed signals regarding the NZD/JPY's future direction. The Relative Strength Index (RSI) sits at 53, indicating positive territory for the pair. The upward slope of the RSI suggests a steady buying pressure. However, the Moving Average Convergence Divergence (MACD) shows signs of increasing selling pressure, with rising red bars in the histogram.
Support levels lie at 91.00 (20-day Simple Moving Average (SMA)), 90.70, and 90.50. Conversely, resistance levels are found at 91.30, 91.50, and 91.70. These levels define the range within which the NZD/JPY has been trading recently.
NZD/JPY Daily chart


