NZD/USD Price Analysis: Bears push lower, 0.6000 support gone

Source Fxstreet
  • NZD/USD retreats further, dropping below 0.6000.
  • Oversold RSI points to possible corrective bounce, but bearish momentum remains strong.
  • The pair stands in lows since early August.

The NZD/USD currency pair has extended its downtrend, with bears maintaining a firm grip as selling momentum builds. During Friday's session, the pair fell by 0.60% to 0.5980, hitting lows not witnessed since August. In addition, the 20-day Simple Moving Average (SMA) is about to complete a bearish crossover with the 100-day SMA which could add selling pressure.

The Relative Strength Index (RSI) remains in oversold territory, currently at 30, indicating intense selling pressure. The RSI's downwards trajectory suggests that bearish momentum is likely to persist, matching the rising red bars on the Moving Average Convergence Divergence (MACD) histogram. That being said, the RSI in oversold terrain might trigger a corrective bounce as sellers might start to run out of steam.

NZD/USD daily chart

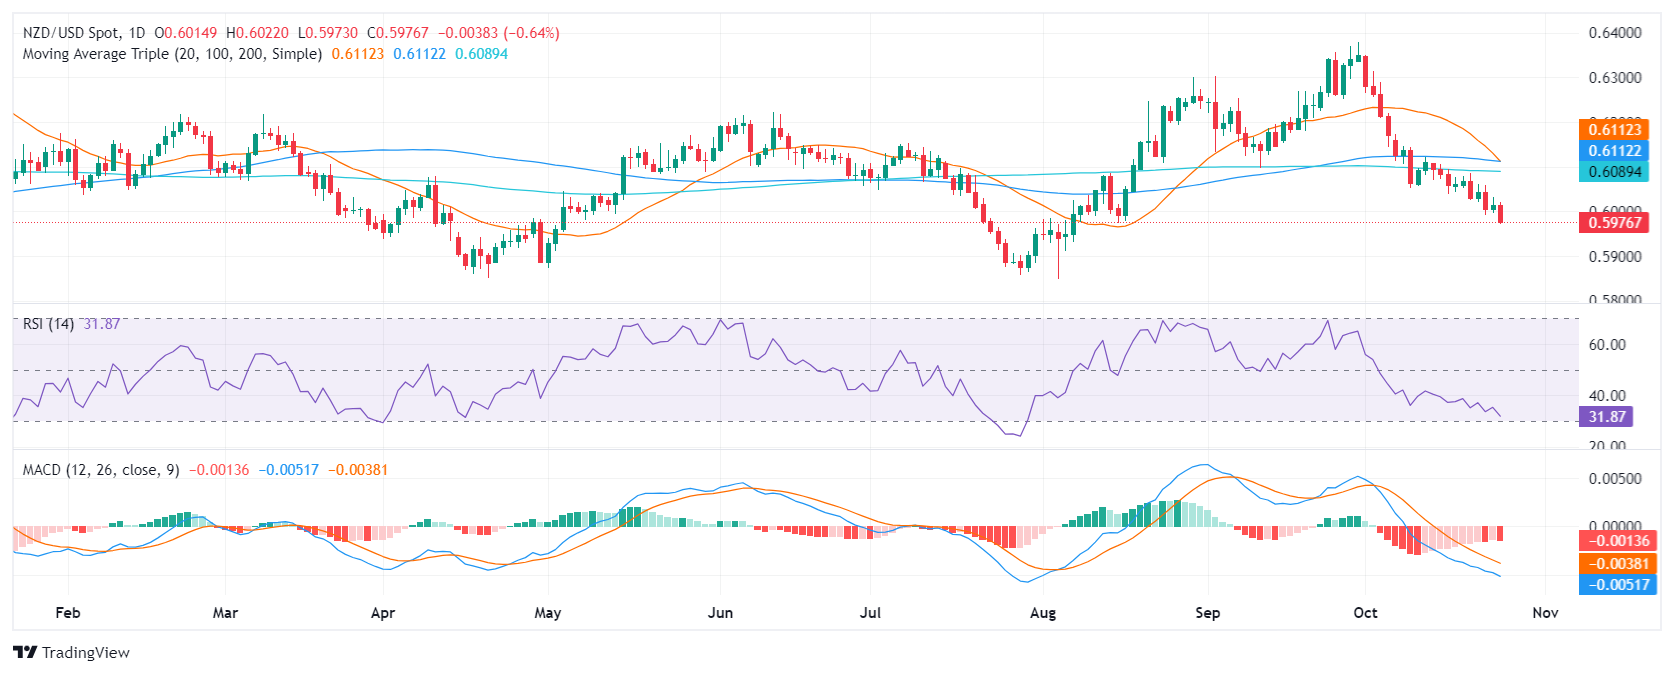
Technically, the NZD/USD pair continues to trade below its key moving averages, with the 100-day Simple Moving Average (SMA) at 0.6100 and the 200-day SMA around 0.6150 creating significant resistance. These hurdles are capping the pair's potential for an upward rebound.


Support levels: 0.5950, 0.5930, 0.5900.

Resistance levels: 0.6000,0.6050, 0.6100.

Disclaimer: For information purposes only. Past performance is not indicative of future results.
placeholder
EURUSD Long-term Forecast: Can ECB Hawks Overcome the Dollar Bullishness? As one of the most traded currency pair in the forex markets, the price of EURUSD affects many traders. Check out our EURUSD long-term forecast for more information.
Author  Mitrade
Mar 13, 2023
As one of the most traded currency pair in the forex markets, the price of EURUSD affects many traders. Check out our EURUSD long-term forecast for more information.
placeholder
Copper Long-term forecast: Will Copper Price Expected To Soar In 2023?The price of copper is affected by various of factors. You may wonder how the price of cooper will be in 2023, check out our forecast analysis.
Author  Mitrade
Mar 13, 2023
The price of copper is affected by various of factors. You may wonder how the price of cooper will be in 2023, check out our forecast analysis.
placeholder
Understanding the first crypto market crash of 2024 and what to expect nextThe 365-day MVRV ratio suggests that this crash may be just the beginning. If the ETF is rejected before the second quarter of 2024, it could trigger a sharp correction.
Author  FXStreet
Jan 04, Thu
The 365-day MVRV ratio suggests that this crash may be just the beginning. If the ETF is rejected before the second quarter of 2024, it could trigger a sharp correction.
placeholder
Natural Gas sinks to pivotal level as China’s demand slumpsNatural Gas price (XNG/USD) edges lower and sinks to $2.56 on Monday, extending its losing streak for the fifth day in a row. The move comes on the back of China cutting its Liquified Natural Gas (LNG) imports after prices rose above $3.0 in June. It
Author  FXStreet
Jul 01, Mon
Natural Gas price (XNG/USD) edges lower and sinks to $2.56 on Monday, extending its losing streak for the fifth day in a row. The move comes on the back of China cutting its Liquified Natural Gas (LNG) imports after prices rose above $3.0 in June. It
placeholder
XRP Price Aims to Recover: Can It Reverse the Downtrend?XRP price extended losses and tested the $0.5120 zone. The price is now rising and might attempt to clear the $0.5320 resistance zone.
Author  NewsBTC
Oct 24, Thu
XRP price extended losses and tested the $0.5120 zone. The price is now rising and might attempt to clear the $0.5320 resistance zone.
Related Instrument
goTop
quote