EUR/GBP Technical Analysis: Continues sideways, capped by 20-day SMA

Source Fxstreet
  • Pair trades sideways within a narrow range, indicating indecisive market sentiment.
  • RSI suggests increasing selling pressure, while MACD signals weakening bullish momentum.
  • The pair remains below the 20-day SMA, indicating a bearish bias in the short term

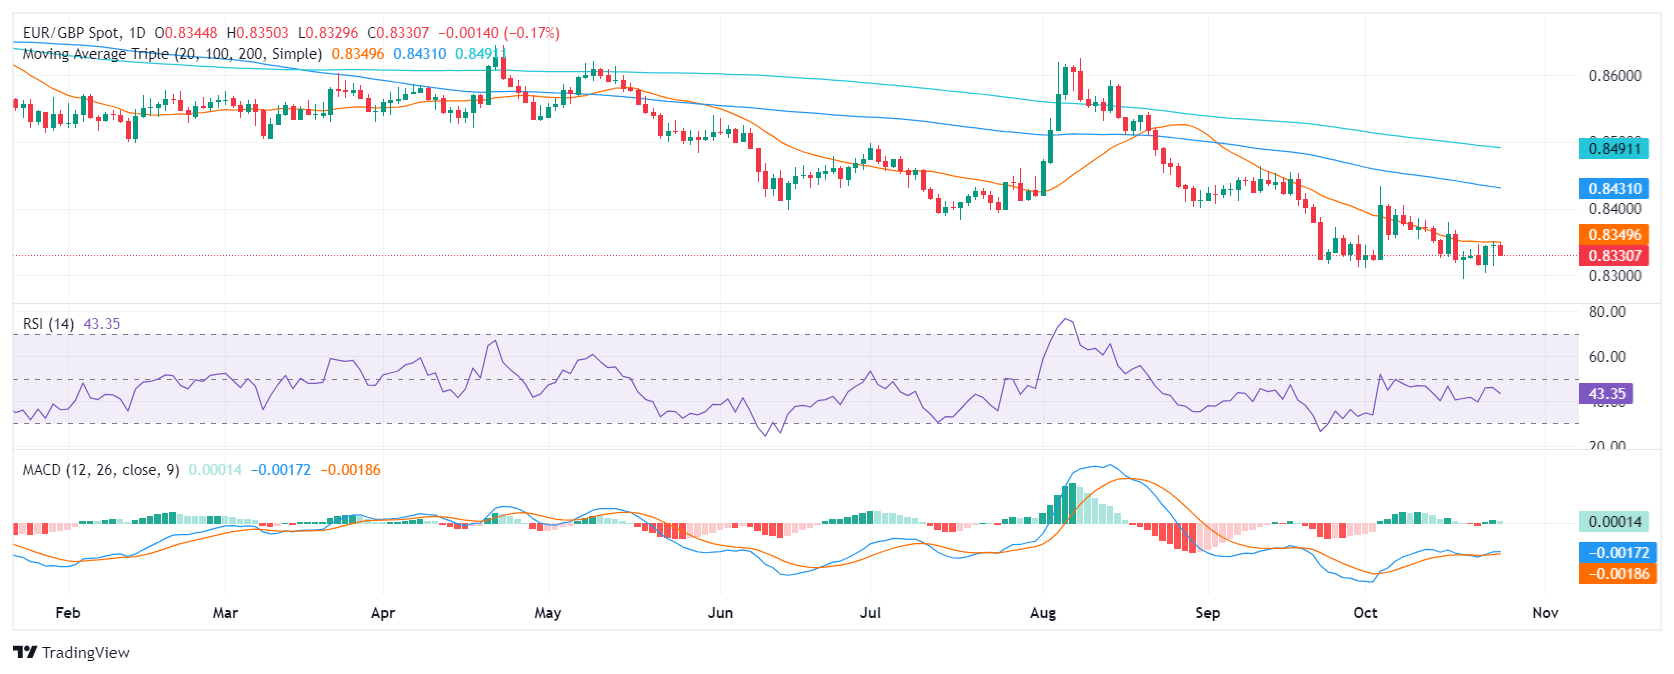
EUR/GBP continues to trade within a constricted range, with limited price movements in recent sessions. The pair currently trades near 0.8340 having faced resistance at the 20-day SMA, maintaining a neutral bias. 

Analyzing the technical indicators, the Relative Strength Index (RSI) has declined to 45, suggesting increasing selling pressure. The MACD, while still in positive territory, is decreasing, indicating weakening buying momentum. This confluence of signals points to a neutral to slightly bearish bias in the short term.

Support levels are seen at 0.8330, 0.8315, and 0.8300, while resistance levels stand at 0.8350, 0.8370, and 0.8400. In the near term, the pair is likely to continue trading within this range unless buyers manage to break above the 20-day SMA, thereby shifting the technical outlook more favorably.

EUR/GBP daily chart
Disclaimer: For information purposes only. Past performance is not indicative of future results.
placeholder
Understanding the first crypto market crash of 2024 and what to expect nextThe 365-day MVRV ratio suggests that this crash may be just the beginning. If the ETF is rejected before the second quarter of 2024, it could trigger a sharp correction.
Author  FXStreet
Jan 04, Thu
The 365-day MVRV ratio suggests that this crash may be just the beginning. If the ETF is rejected before the second quarter of 2024, it could trigger a sharp correction.
placeholder
Natural Gas sinks to pivotal level as China’s demand slumpsNatural Gas price (XNG/USD) edges lower and sinks to $2.56 on Monday, extending its losing streak for the fifth day in a row. The move comes on the back of China cutting its Liquified Natural Gas (LNG) imports after prices rose above $3.0 in June. It
Author  FXStreet
Jul 01, Mon
Natural Gas price (XNG/USD) edges lower and sinks to $2.56 on Monday, extending its losing streak for the fifth day in a row. The move comes on the back of China cutting its Liquified Natural Gas (LNG) imports after prices rose above $3.0 in June. It
placeholder
The $589 XRP Dream: Believers Aren’t ‘Delusional’ Enough, Expert SaysA known market analyst sees the $6 per coin prediction for XRP crypto being claimed by some experts as too conservative.
Author  NewsBTC
Dec 17, Tue
A known market analyst sees the $6 per coin prediction for XRP crypto being claimed by some experts as too conservative.
placeholder
XRP Price Steals the Spotlight: Dips Look Increasingly AttractiveXRP price started a fresh increase above the $2.50 zone. The price is now consolidating gains and might soon aim for a move above the $2.62 resistance. XRP price started a fresh increase above the
Author  NewsBTC
Dec 18, Wed
XRP price started a fresh increase above the $2.50 zone. The price is now consolidating gains and might soon aim for a move above the $2.62 resistance. XRP price started a fresh increase above the
placeholder
Nvidia vs. Broadcom: Which Is the Better AI Chip Stock to Own in 2025?When it came to artificial intelligence (AI) infrastructure in 2024, Nvidia (NASDAQ: NVDA) reigned supreme.
Author  The Motley Fool
Dec 19, Thu
When it came to artificial intelligence (AI) infrastructure in 2024, Nvidia (NASDAQ: NVDA) reigned supreme.
Related Instrument
goTop
quote