
USD/CAD Price Forecast: Rally pauses near 1.3850 for a while
- USD/CAD falls slightly to near 1.3820 after refreshing an 11-week high.
- The BoC cut its key borrowing rates by 50 bps to 3.75% on Wednesday, as expected.
- The US Dollar holds onto gains as the Fed is expected to cut rates gradually.
The USD/CAD pair corrects slightly to near 1.3820 in Thursday’s European session after posting a fresh 11-week high above 1.3850 on Wednesday. The Loonie pair has shown a one-sided rally since September 25, which appears to have paused for a while as investors look for fresh cues about the likely monetary policy action by the Bank of Canada (BoC) and the Federal Reserve (Fed) in the remaining year.
On Wednesday, the BoC reduced its key borrowing rates by 50 basis points (bps) to 3.75%, as expected. This was the fourth straight interest rate cut by the BoC in a row. The BoC has cut its interest rates by 125 basis points (bps) this year as officials are worried about the continuation of the disinflationary trend due to weak economic growth.
Going forward, the Canadian Dollar (CAD) will be influenced by the monthly Retail Sales data for August, which will be published on Friday. The Retail Sales data, a key measure of consumer spending, is estimated to have grown by 0.5%, slower than 0.9% in July.
Meanwhile, the US Dollar (USD) clings to gains slightly above the August high as investors expect the Fed to follow a gradual policy-easing approach as upbeat Nonfarm Payrolls (NFP), Services PMI, and Retail Sales data for September have diminished risks of a downturn.
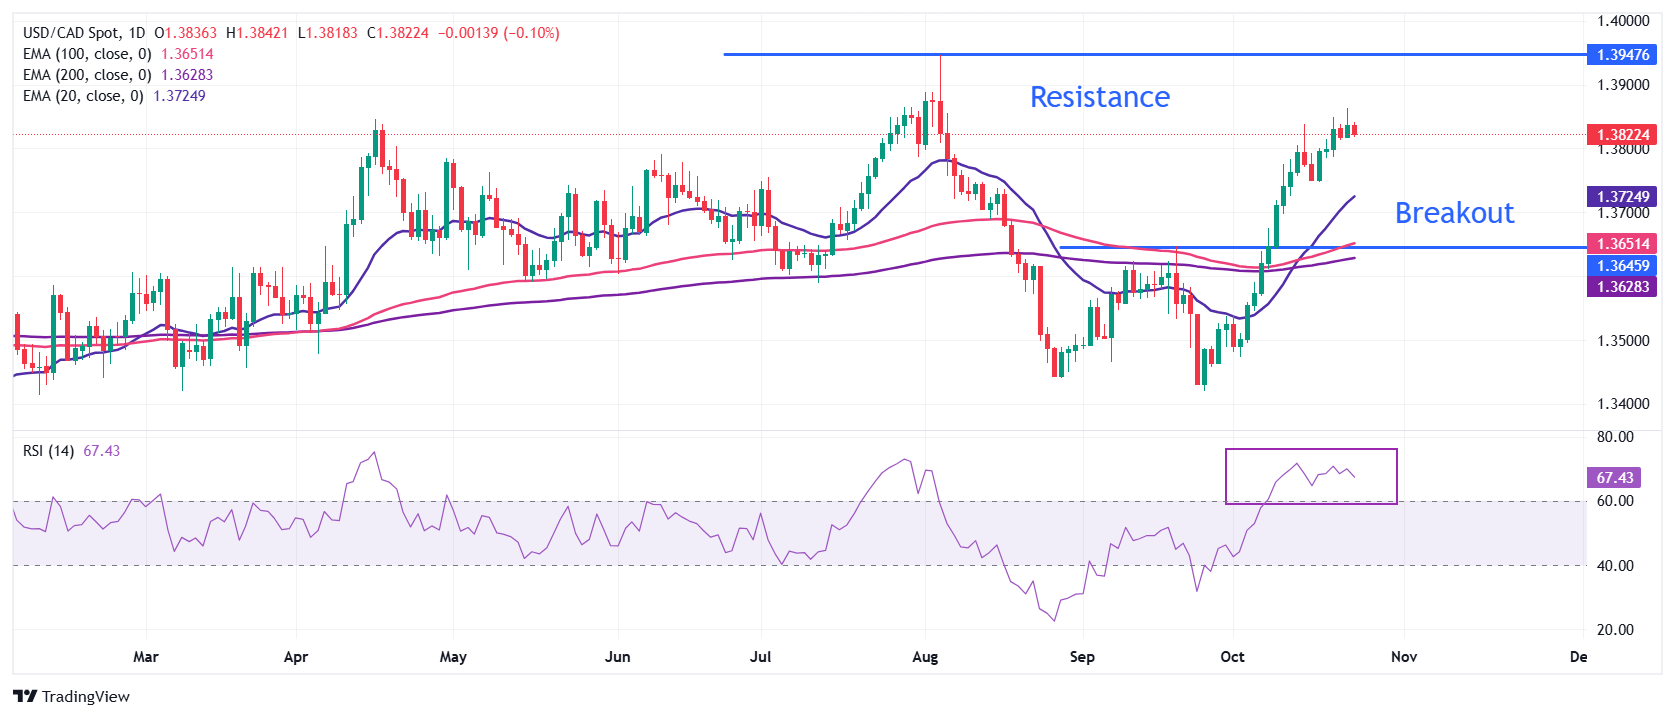
USD/CAD witnessed strong buying interest after a breakout above the September 19 high around 1.3650.
The near-term outlook of the Loonie pair remains firm as the 20- and 50-day Exponential Moving Averages (EMAs) near 1.3725 and 1.36665, respectively, are sloping higher.
The 14-day Relative Strength Index (RSI) oscillates inside the bullish range of 60.00-80.00, pointing to an active momentum.
More upside towards the round-level resistance of 1.3900 and Year-To-Date (YTD) high of 1.3945 would appear if the pair decisively breaks above Wednesday’s high of 1.3863.
In an alternate scenario, a downside move below the September 19 high around 1.3650 will expose the asset to May 16 low near 1.3600, followed by September 13 high of 1.3538.
USD/CAD daily chart
Canadian Dollar FAQs
The key factors driving the Canadian Dollar (CAD) are the level of interest rates set by the Bank of Canada (BoC), the price of Oil, Canada’s largest export, the health of its economy, inflation and the Trade Balance, which is the difference between the value of Canada’s exports versus its imports. Other factors include market sentiment – whether investors are taking on more risky assets (risk-on) or seeking safe-havens (risk-off) – with risk-on being CAD-positive. As its largest trading partner, the health of the US economy is also a key factor influencing the Canadian Dollar.
The Bank of Canada (BoC) has a significant influence on the Canadian Dollar by setting the level of interest rates that banks can lend to one another. This influences the level of interest rates for everyone. The main goal of the BoC is to maintain inflation at 1-3% by adjusting interest rates up or down. Relatively higher interest rates tend to be positive for the CAD. The Bank of Canada can also use quantitative easing and tightening to influence credit conditions, with the former CAD-negative and the latter CAD-positive.
The price of Oil is a key factor impacting the value of the Canadian Dollar. Petroleum is Canada’s biggest export, so Oil price tends to have an immediate impact on the CAD value. Generally, if Oil price rises CAD also goes up, as aggregate demand for the currency increases. The opposite is the case if the price of Oil falls. Higher Oil prices also tend to result in a greater likelihood of a positive Trade Balance, which is also supportive of the CAD.
While inflation had always traditionally been thought of as a negative factor for a currency since it lowers the value of money, the opposite has actually been the case in modern times with the relaxation of cross-border capital controls. Higher inflation tends to lead central banks to put up interest rates which attracts more capital inflows from global investors seeking a lucrative place to keep their money. This increases demand for the local currency, which in Canada’s case is the Canadian Dollar.
Macroeconomic data releases gauge the health of the economy and can have an impact on the Canadian Dollar. Indicators such as GDP, Manufacturing and Services PMIs, employment, and consumer sentiment surveys can all influence the direction of the CAD. A strong economy is good for the Canadian Dollar. Not only does it attract more foreign investment but it may encourage the Bank of Canada to put up interest rates, leading to a stronger currency. If economic data is weak, however, the CAD is likely to fall.
Recommended Articles


