
USD/CAD Price Forecast: Tests 1.3800 in an attempt to re-enter the ascending channel
- The USD/CAD pair grapples to return to the ascending channel as bullish bias is in play.
- The 14-day RSI hovers near the 70 mark, suggesting overbought conditions and a potential downward correction ahead.
- A break below the nine-day EMA at the 1.3741 level could cause the emergence of a bearish trend.
The USD/CAD pair maintains its position on recent gains from the previous session, trading around 1.3800 during the Asian hours on Friday. On the daily chart, the analysis shows that the pair is testing the lower boundary to return to the ascending channel pattern, which, if remains within the channel, supports the bullish trend.
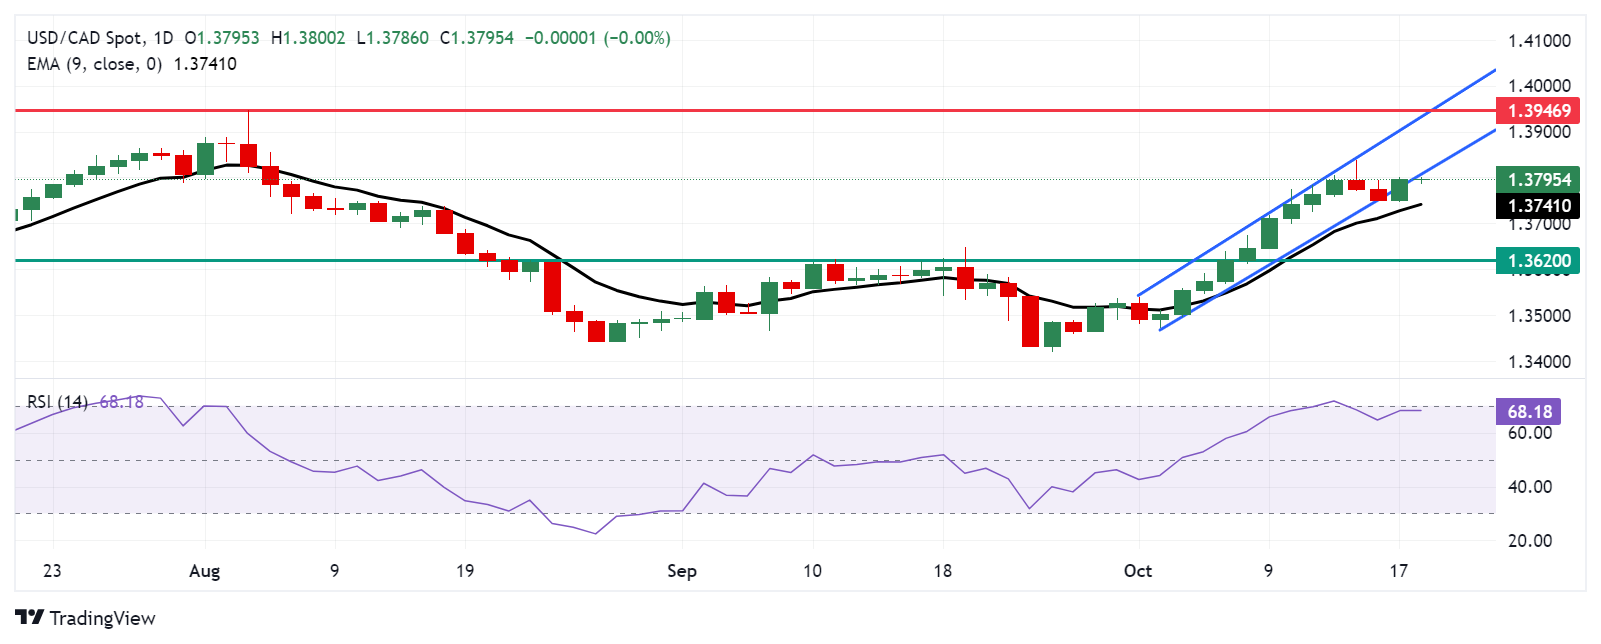
The 14-day Relative Strength Index (RSI) is slightly below 70 level, confirming the ongoing bullish sentiment is in play. However, a move above the 70 mark would suggest overbought conditions and signal a potential downward correction.
On the upside, the USD/CAD pair tests the immediate barrier at the lower boundary of the ascending channel at the 1.3810 level. A return to the ascending channel would reinforce the bullish bias and support the pair to explore the region around the upper boundary of the ascending channel around 1.3920 level. Further resistance appears at the 25-month high of 1.3946 level, which was recorded on August 5.
In terms of support, the USD/CAD pair could find immediate support around the nine-day Exponential Moving Average (EMA) at 1.3741 level. A break below this level could cause the emergence of the bearish trend for a short-term period and put pressure on the pair to navigate the area around the former resistance, now acting as support, around 1.3620, followed by the key psychological level of 1.3600 just below.
USD/CAD: Daily Chart
Canadian Dollar PRICE Today
The table below shows the percentage change of Canadian Dollar (CAD) against listed major currencies today. Canadian Dollar was the strongest against the US Dollar.
| USD | EUR | GBP | JPY | CAD | AUD | NZD | CHF | |
|---|---|---|---|---|---|---|---|---|
| USD | -0.11% | -0.13% | -0.25% | -0.02% | -0.16% | -0.06% | -0.02% | |
| EUR | 0.11% | -0.00% | -0.15% | 0.09% | -0.07% | 0.06% | 0.09% | |
| GBP | 0.13% | 0.00% | -0.12% | 0.10% | -0.04% | 0.08% | 0.07% | |
| JPY | 0.25% | 0.15% | 0.12% | 0.25% | 0.10% | 0.18% | 0.21% | |
| CAD | 0.02% | -0.09% | -0.10% | -0.25% | -0.14% | -0.04% | -0.04% | |
| AUD | 0.16% | 0.07% | 0.04% | -0.10% | 0.14% | 0.10% | 0.11% | |
| NZD | 0.06% | -0.06% | -0.08% | -0.18% | 0.04% | -0.10% | 0.00% | |
| CHF | 0.02% | -0.09% | -0.07% | -0.21% | 0.04% | -0.11% | -0.01% |
The heat map shows percentage changes of major currencies against each other. The base currency is picked from the left column, while the quote currency is picked from the top row. For example, if you pick the Canadian Dollar from the left column and move along the horizontal line to the US Dollar, the percentage change displayed in the box will represent CAD (base)/USD (quote).
Recommended Articles


