EUR/JPY Price Forecast: Reaches top of a nine-week range, risks rolling over

Source Fxstreet
  • EUR/JPY has rallied up to the top of a medium-term range and risks rolling over as the mode extends. 
  • MACD momentum is declining steadily suggesting underlying weakness. 


EUR/JPY rises up and almost touches the top of its nine-week range before treading water indecisively as traders await the next catalyst that will decide its future direction. 

EUR/JPY 4-hour Chart 
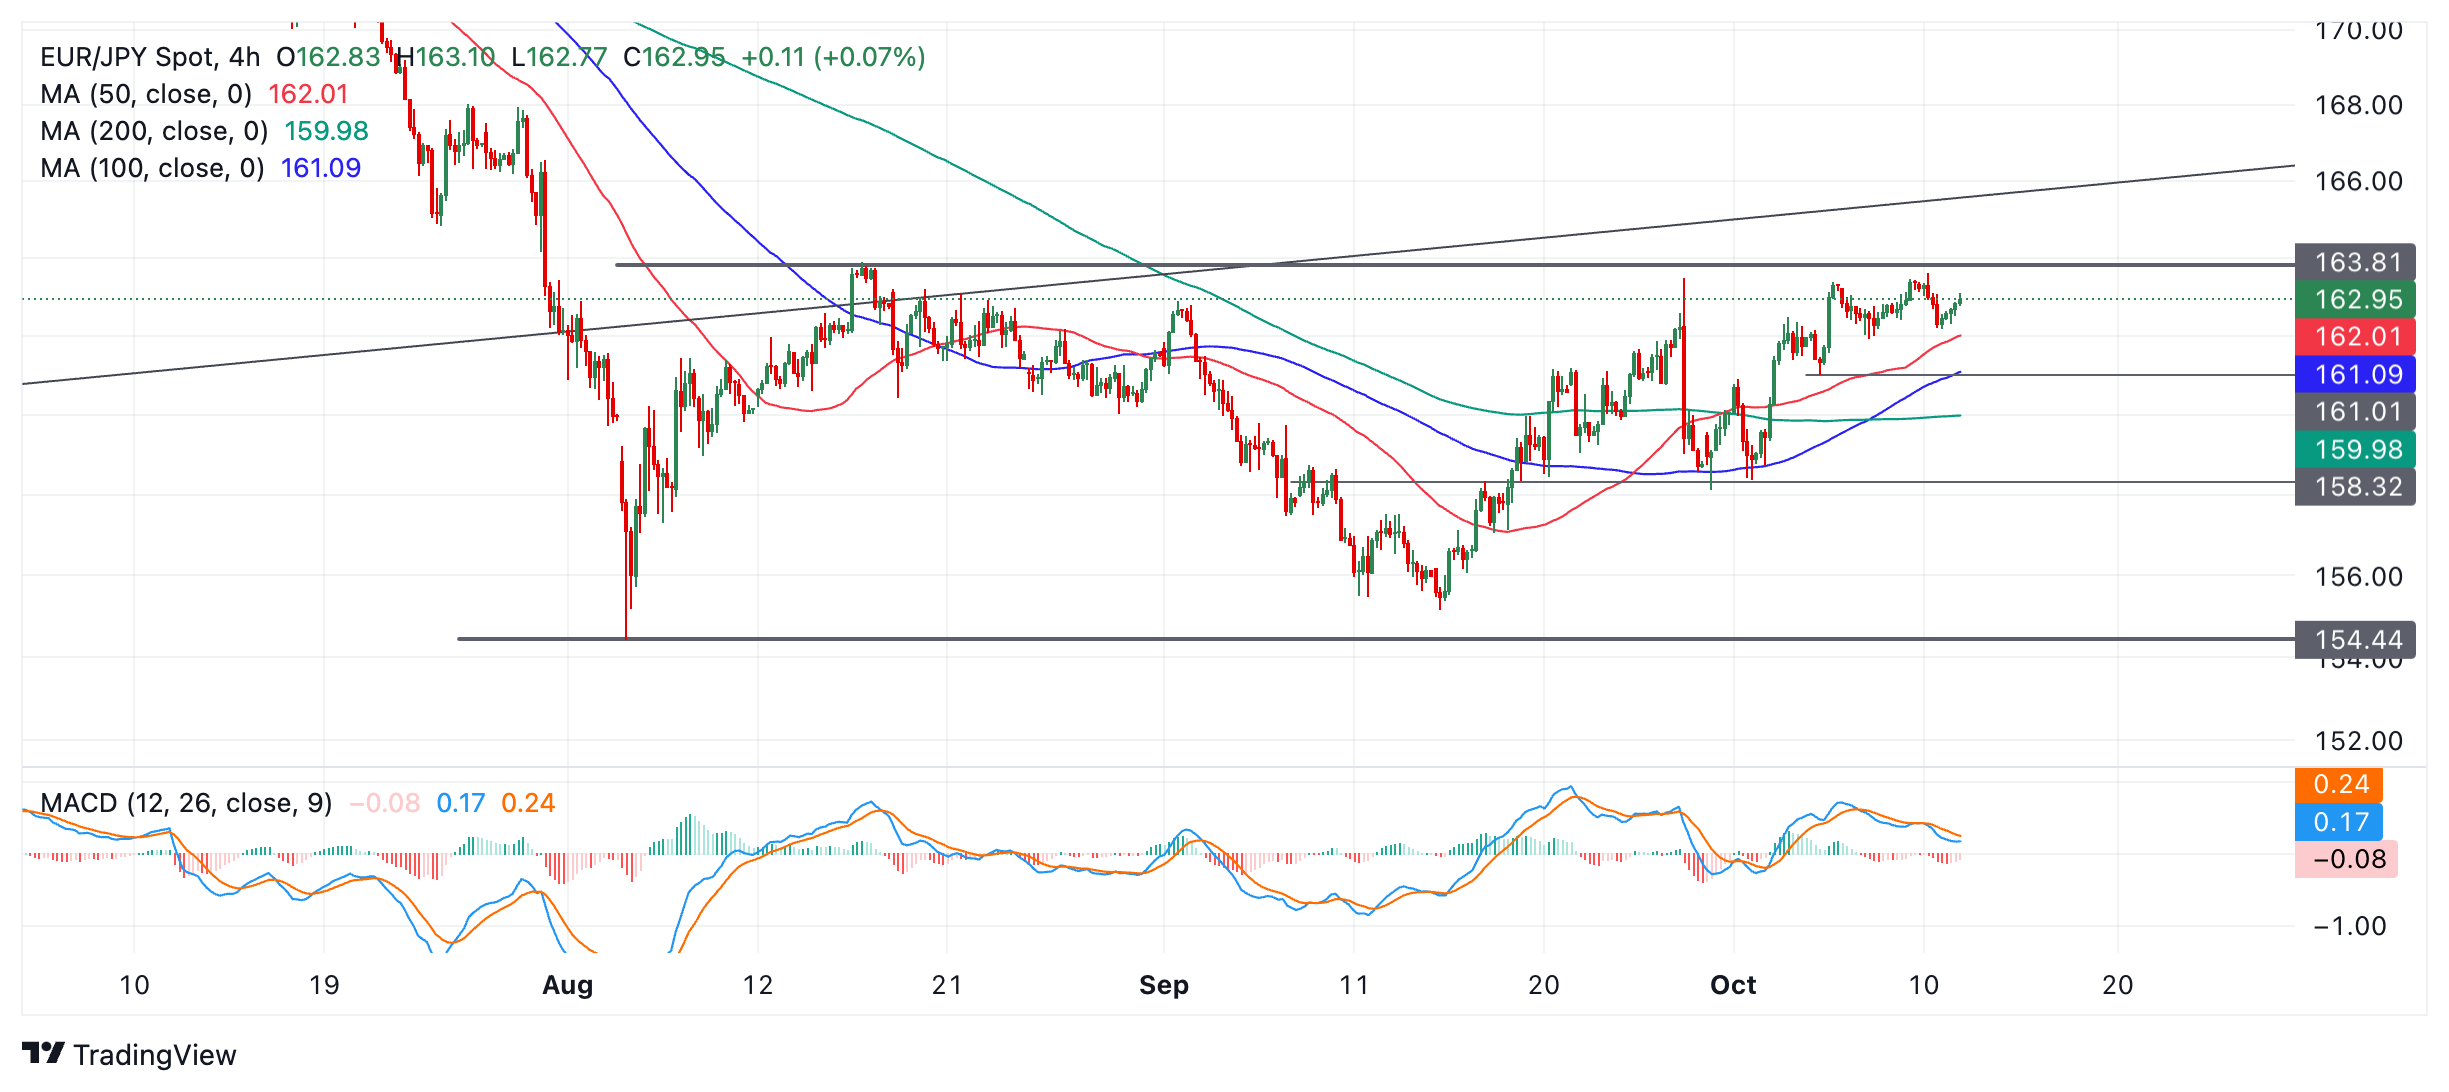
The pair is probably in a short-term sideways trend and given the guiding principle of technical analysis that “the trend is your friend”, this would suggest an extension of that sideways mode. If so, then the next move for EUR/JPY is likely to be back down towards the base of the range in the 154s. 

However, there are no reversal signs from price yet and so it is too early to say with any confidence that the pair will fall. A break below 161.00 would be required to supply the additional bearish confirmation to confirm such a down leg. The next downside target for EUR/JPY is at about 158.32 and the October 1 as well as September 30 lows. 

The Moving Average Convergence Divergence (MACD) momentum indicator is diverging bearishly with price. Although the MACD is currently declining, price is oscillating, suggesting weak underlying momentum underpins current price action and tilts the odds marginally in favor of more downside.


Disclaimer: For information purposes only. Past performance is not indicative of future results.
placeholder
Bitcoin CME gaps at $35,000, $27,000 and $21,000, which one gets filled first?Prioritize filling the $27,000 gap and even try higher.
Author  FXStreet
Aug 21, 2023
Prioritize filling the $27,000 gap and even try higher.
placeholder
Natural Gas sinks to pivotal level as China’s demand slumpsNatural Gas price (XNG/USD) edges lower and sinks to $2.56 on Monday, extending its losing streak for the fifth day in a row. The move comes on the back of China cutting its Liquified Natural Gas (LNG) imports after prices rose above $3.0 in June. It
Author  FXStreet
Jul 01, Mon
Natural Gas price (XNG/USD) edges lower and sinks to $2.56 on Monday, extending its losing streak for the fifth day in a row. The move comes on the back of China cutting its Liquified Natural Gas (LNG) imports after prices rose above $3.0 in June. It
placeholder
Here’s Why Dogecoin Is Poised For A Major Bullish ReversalThe Dogecoin (DOGE) price appears primed for a significant bullish reversal, supported by technical indicators and market sentiment data. Despite recent downward pressures, several factors suggest a potential upward trajectory for the popular memecoin.
Author  NewsBTC
Dec 19, Thu
The Dogecoin (DOGE) price appears primed for a significant bullish reversal, supported by technical indicators and market sentiment data. Despite recent downward pressures, several factors suggest a potential upward trajectory for the popular memecoin.
placeholder
Nvidia vs. Broadcom: Which Is the Better AI Chip Stock to Own in 2025?When it came to artificial intelligence (AI) infrastructure in 2024, Nvidia (NASDAQ: NVDA) reigned supreme.
Author  The Motley Fool
Dec 19, Thu
When it came to artificial intelligence (AI) infrastructure in 2024, Nvidia (NASDAQ: NVDA) reigned supreme.
placeholder
US Dollar hits fresh two-year high ahead of PCE inflationThe US Dollar (USD) retreats slightly on Friday, with the DXY Index trading at around 108.20 after eking out another fresh two-year high of 108.55 during the Asian-Pacific trading session. The move was supported by rising US Treasury yields, widening
Author  FXStreet
Yesterday 12: 46
The US Dollar (USD) retreats slightly on Friday, with the DXY Index trading at around 108.20 after eking out another fresh two-year high of 108.55 during the Asian-Pacific trading session. The move was supported by rising US Treasury yields, widening
Related Instrument
goTop
quote