EUR/USD Price Prediction: Chart of bad omens with break below trendline, Double Top

Source Fxstreet
  • EUR/USD has broken below a key trendline and might have formed a bearish pattern. 
  • A Double Top reversal pattern could potentially be a bad omen for the pair. 
     

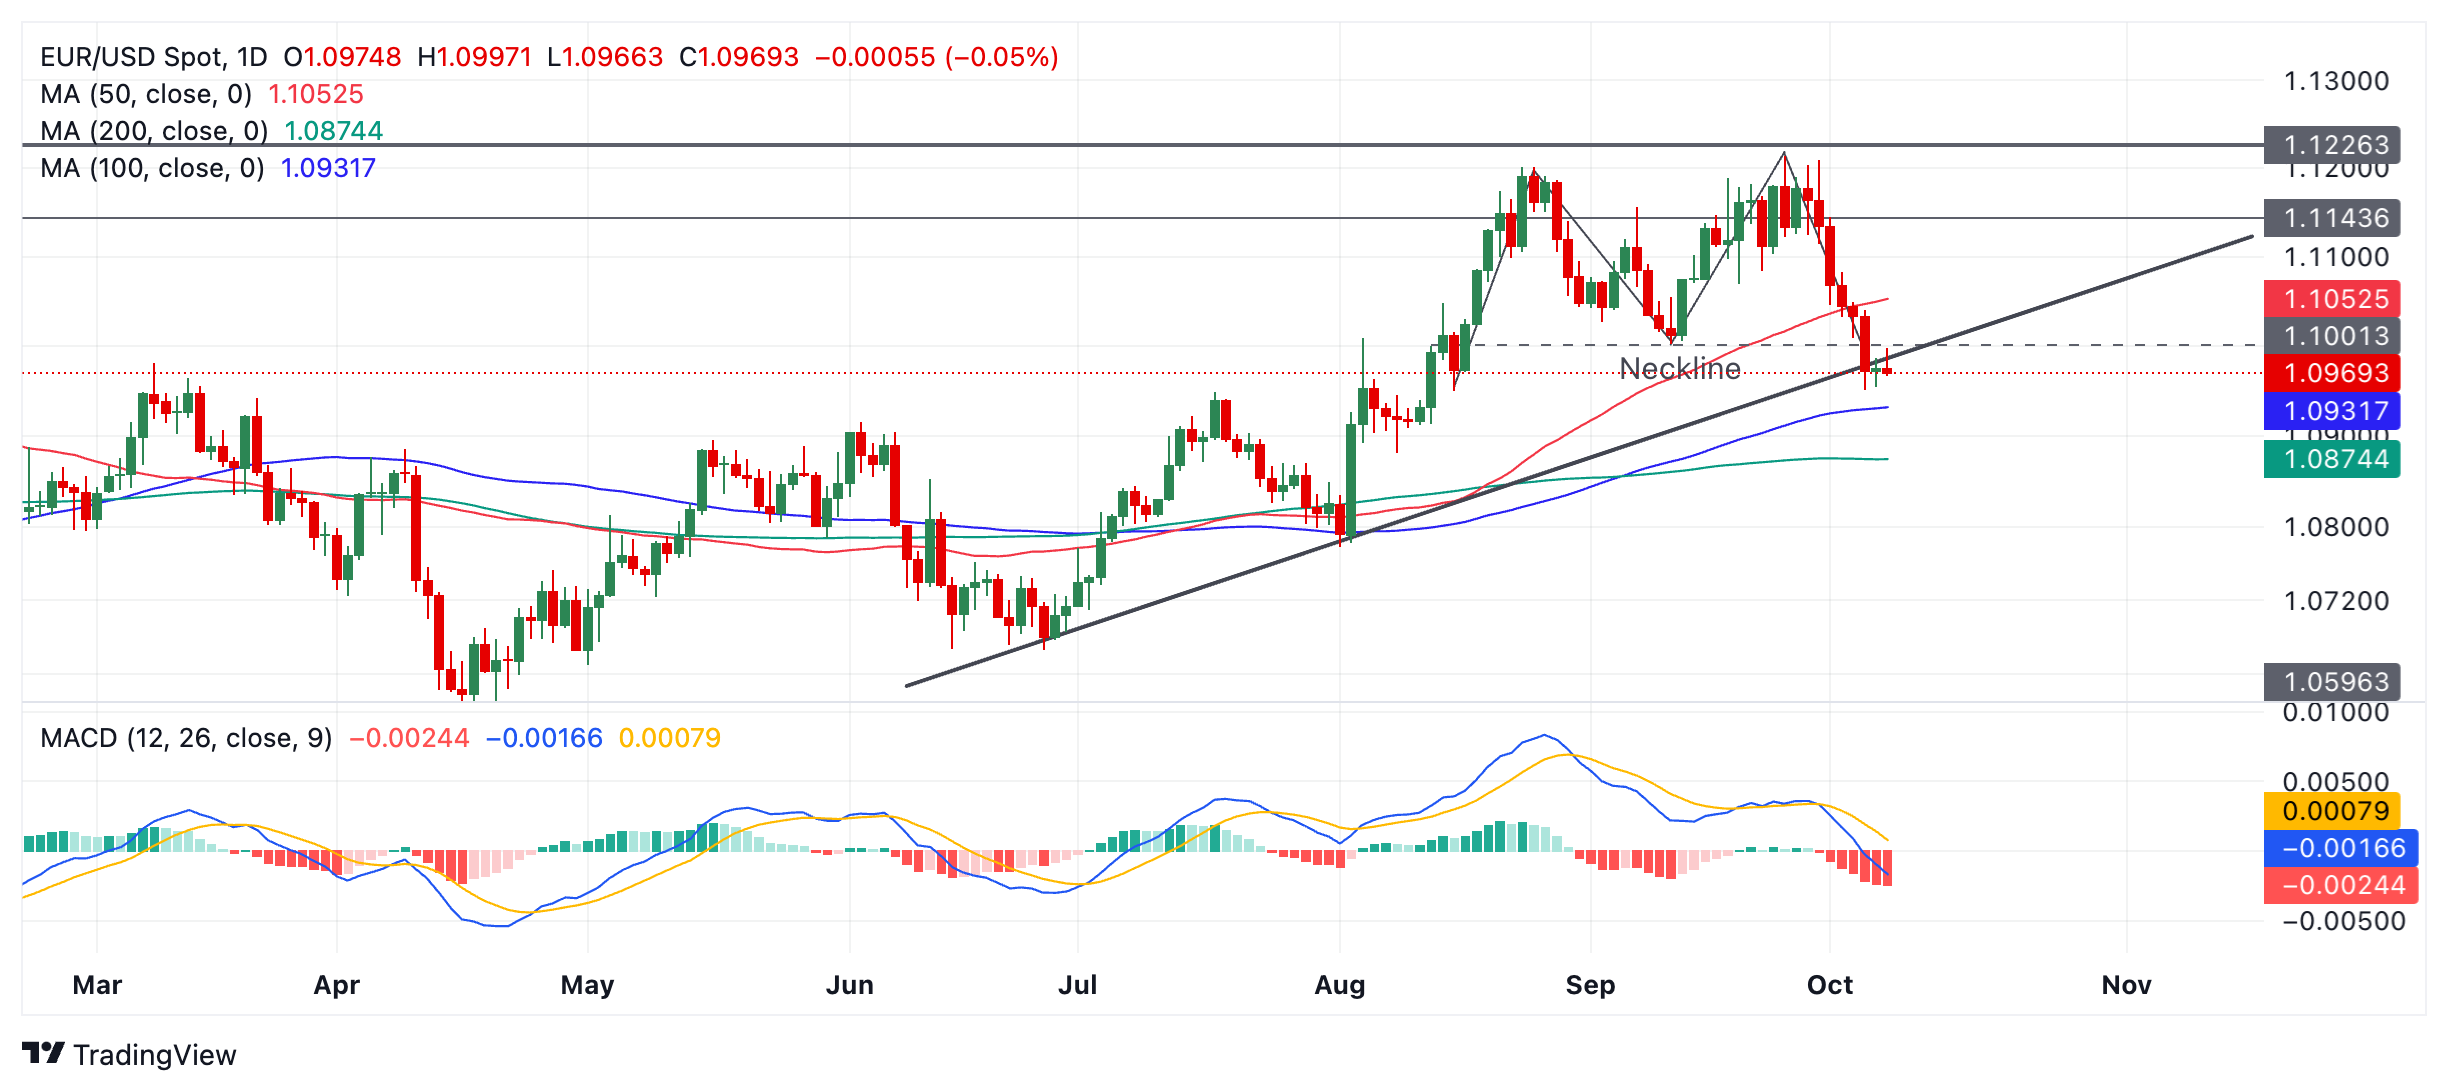
EUR/USD breaks below the trendline for the rally since June. On Tuesday it executes a throwback move to “air kiss the trendline goodbye” and now seems to be declining again.

The overall tenor of the chart suggests a bearish short-term outlook. Momentum as measured by the Moving Average Convergence Divergence (MACD) is in negative territory. If prices can close below Friday’s low at 1.0951 the break will be confirmed and a deeper decline is likely to unfold. 

EUR/USD Daily Chart 


A confirmed break of the trendline would likely lead to a deeper sell-off. Such a move might reach a target at 1.0865 initially (the 61.8% Fibonacci (Fib) extrapolation of the move prior to the trendline break). The 200-day Simple Moving Average (SMA), however, could come in with support a little before then at 1.0875, suggesting another more conservative option. 

Adding to the bearish picture is the possible Double Top price pattern which might have formed during September. This is the “M” shaped pattern formed  just under the heavy resistance line at 1.1226. Double Tops are signals that the uptrend has reached its conclusion and price is reversing. The pattern's "neckline" at 1.1001 has already been broken, confirming activation of the pattern’s downside target at 1.0858, the 61.8% Fib extrapolation of the height of the pattern lower. 


Disclaimer: For information purposes only. Past performance is not indicative of future results.
placeholder
Australian Dollar gathers strength after RBA MinutesThe Australian Dollar (AUD) trades on a stronger note on Tuesday, snapping the three-day losing streak.
Author  FXStreet
15 hour ago
The Australian Dollar (AUD) trades on a stronger note on Tuesday, snapping the three-day losing streak.
placeholder
Bitcoin (BTC) Price Faces Tough Road to $70,000, Key Indicators Reveal Despite Bitcoin’s (BTC) price increase in the last 24 hours, key market indicators are flashing caution, suggesting that the coin may face significant hurdles in reaching the $70,000 mark. This development is contrary to the expectations investors have about the coin this month.
Author  Beincrypto
15 hour ago
Despite Bitcoin’s (BTC) price increase in the last 24 hours, key market indicators are flashing caution, suggesting that the coin may face significant hurdles in reaching the $70,000 mark. This development is contrary to the expectations investors have about the coin this month.
placeholder
1 Growth Stock Down 55% to Buy Right NowIf you're looking for a bargain-priced growth opportunity, look no further than Shopify (NYSE: SHOP). Although shares are up more than 200% from their late 2022 low, they're also still down 55% from their 2021 peak. More importantly, they're currently chugging higher for all the right reasons.
Author  The Motley Fool
15 hour ago
If you're looking for a bargain-priced growth opportunity, look no further than Shopify (NYSE: SHOP). Although shares are up more than 200% from their late 2022 low, they're also still down 55% from their 2021 peak. More importantly, they're currently chugging higher for all the right reasons.
placeholder
Penn Entertainment sees narrower Q3 loss for online businessInvesting.com-- PENN Entertainment Inc (NASDAQ:PENN) said on Monday that it expects a narrower loss from its online gaming business in the third quarter, citing better conditions in the sector and lower expenses.
Author  Investing.com
15 hour ago
Investing.com-- PENN Entertainment Inc (NASDAQ:PENN) said on Monday that it expects a narrower loss from its online gaming business in the third quarter, citing better conditions in the sector and lower expenses.
placeholder
Japanese Yen strengthens against USD, recovers further from Friday’s two-month low The Japanese Yen (JPY) remains on the front foot against its American counterpart for the second successive day on Tuesday and drags the USD/JPY pair away from its highest level since August 16 touched the previous day.
Author  FXStreet
15 hour ago
The Japanese Yen (JPY) remains on the front foot against its American counterpart for the second successive day on Tuesday and drags the USD/JPY pair away from its highest level since August 16 touched the previous day.
Related Instrument
goTop
quote