
AUD/USD Price Analysis: Slides further below 50-day EMA near 0.6750
- AUD/USD falls further below 0.6750 amid weakness in the Australian Dollar.
- The RBA minutes didn’t offer any significant cues about the likely interest rate action for the remaining year.
- The outlook of the US Dollar will be influenced by the US CPI data for September.
The AUD/USD pair extends its losing streak for the fourth trading day on Tuesday. The Aussie asset declines to near 0.6720 as the Australian Dollar (AUD) weakens after the release of the Reserve Bank of Australia (RBA) minutes, which didn’t offer any significant cue about the likely interest rate action in the November meeting.
The RBA minutes showed that policymakers discussed scenarios for hiking interest rates or pivoting to policy normalization. However, the board remained vigilant to upside risks to inflation. Currently, financial markets expect the RBA to leave its Official Cash Rate (OCR) unchanged at 4.35% by the year-end.
Meanwhile, an absence of details about the likely size of Beijing's recently unveiled stimulus package has also dampened the Australian Dollar’s appeal, being a proxy to China’s economic growth.
In the North American region, the US Dollar (USD) has turned sideways after revisiting a seven-week high as investors await fresh cues about the Federal Reserve’s (Fed) possible monetary policy action in the remainder of the year. According to the CME FedWatch tool, the Fed is expected to cut interest rates further by 25 basis points (bps) in each of its remaining two policy meetings this year.
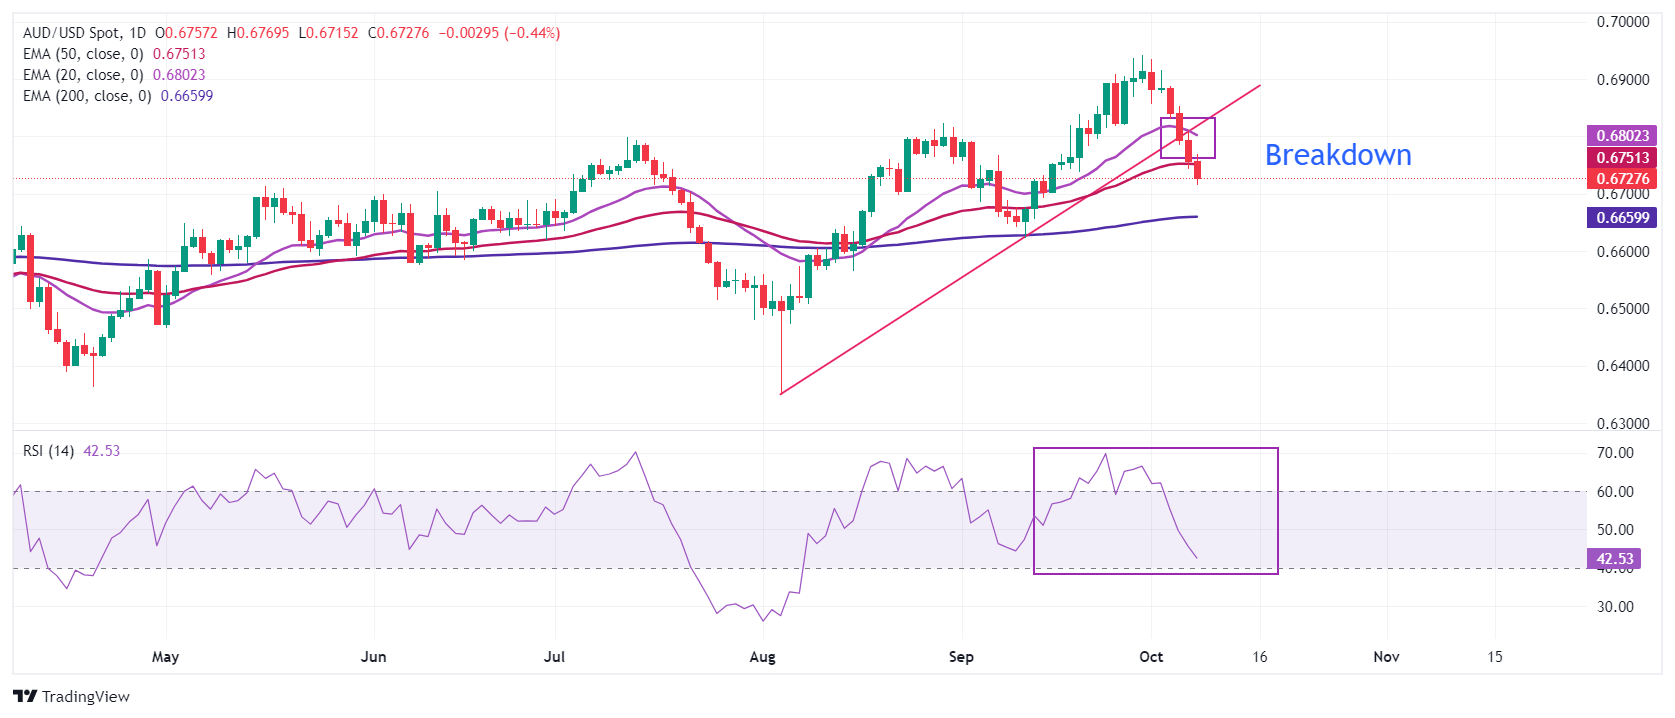
AUD/USD sees a sharp downside after a breakdown below the upward-sloping trendline plotted from the August 5 low around 0.6350. The Aussie asset slides below the 20- and 50-day Exponential Moving Averages (EMAs), which trade around 0.6800 and 0.6750, respectively.
The 14-day Relative Strength Index (RSI) slides to near 40.00, suggesting a weakening of momentum.
The pair could witness more downside towards the 200-day EMA near 0.6660 and the August 12 high of 0.6605 if it breaks below the round-level support of 0.6700.
In an alternate scenario, a decisive recovery move above the 20-day EMA at 0.6800 could push the asset towards October 4 high of 0.6850, followed by October 3 high of 0.6888.
AUD/USD daily chart
Australian Dollar FAQs
One of the most significant factors for the Australian Dollar (AUD) is the level of interest rates set by the Reserve Bank of Australia (RBA). Because Australia is a resource-rich country another key driver is the price of its biggest export, Iron Ore. The health of the Chinese economy, its largest trading partner, is a factor, as well as inflation in Australia, its growth rate and Trade Balance. Market sentiment – whether investors are taking on more risky assets (risk-on) or seeking safe-havens (risk-off) – is also a factor, with risk-on positive for AUD.
The Reserve Bank of Australia (RBA) influences the Australian Dollar (AUD) by setting the level of interest rates that Australian banks can lend to each other. This influences the level of interest rates in the economy as a whole. The main goal of the RBA is to maintain a stable inflation rate of 2-3% by adjusting interest rates up or down. Relatively high interest rates compared to other major central banks support the AUD, and the opposite for relatively low. The RBA can also use quantitative easing and tightening to influence credit conditions, with the former AUD-negative and the latter AUD-positive.
China is Australia’s largest trading partner so the health of the Chinese economy is a major influence on the value of the Australian Dollar (AUD). When the Chinese economy is doing well it purchases more raw materials, goods and services from Australia, lifting demand for the AUD, and pushing up its value. The opposite is the case when the Chinese economy is not growing as fast as expected. Positive or negative surprises in Chinese growth data, therefore, often have a direct impact on the Australian Dollar and its pairs.
Iron Ore is Australia’s largest export, accounting for $118 billion a year according to data from 2021, with China as its primary destination. The price of Iron Ore, therefore, can be a driver of the Australian Dollar. Generally, if the price of Iron Ore rises, AUD also goes up, as aggregate demand for the currency increases. The opposite is the case if the price of Iron Ore falls. Higher Iron Ore prices also tend to result in a greater likelihood of a positive Trade Balance for Australia, which is also positive of the AUD.
The Trade Balance, which is the difference between what a country earns from its exports versus what it pays for its imports, is another factor that can influence the value of the Australian Dollar. If Australia produces highly sought after exports, then its currency will gain in value purely from the surplus demand created from foreign buyers seeking to purchase its exports versus what it spends to purchase imports. Therefore, a positive net Trade Balance strengthens the AUD, with the opposite effect if the Trade Balance is negative.
Recommended Articles


