


NZD/USD Price Forecast: Falls further below 0.6150 as traders brace for RBNZ policy decision
- NZD/USD slides below 0.6150 as investors turn cautious ahead of RBNZ policy decision.
- Middle East tensions have kept the risk-aversion theme intact.
- NZD/USD trades below the 20- and 50-day EMAs.
The NZD/USD pair extends its losing spree for the fifth trading session on Monday. The Kiwi asset weakens on multiple tailwinds: weakens in the New Zealand Dollar (NZD) amid caution ahead of the Reserve Bank of New Zealand’s (RBNZ) monetary policy decision and a firm US Dollar (USD) due to waned Federal Reserve (Fed) large rate cut bets for November.
Market participants expect the RBNZ to cut its Official Cash Rate (OCR) for the second time on Wednesday. However, the rate cut size is expected to be 50 basis points (bps) against 25 bps. The RBNZ is expected to announce a hefty rate cut with the intention of uplifting economic growth. The Kiwi economy is going through a rough phase due to the poor demand environment in the domestic and global markets.
Meanwhile, an all-out war between Israel and Iran has also dampened the appeal of risk-sensitive assets. The S&P 500 opens on a bearish note. The US Dollar Index (DXY), which gauges Greenback’s value against six major currencies, clings to gains near the seven-week high of 102.60.
The expectations for the Fed another 50-bps rate cut in November have been wiped out after the United States (US) Nonfarm Payrolls (NFP) for September surprisingly came in highest at 254K since March. Going forward, investors will focus on the US Consumer Price Index (CPI) data for September, which will be published on Thursday.
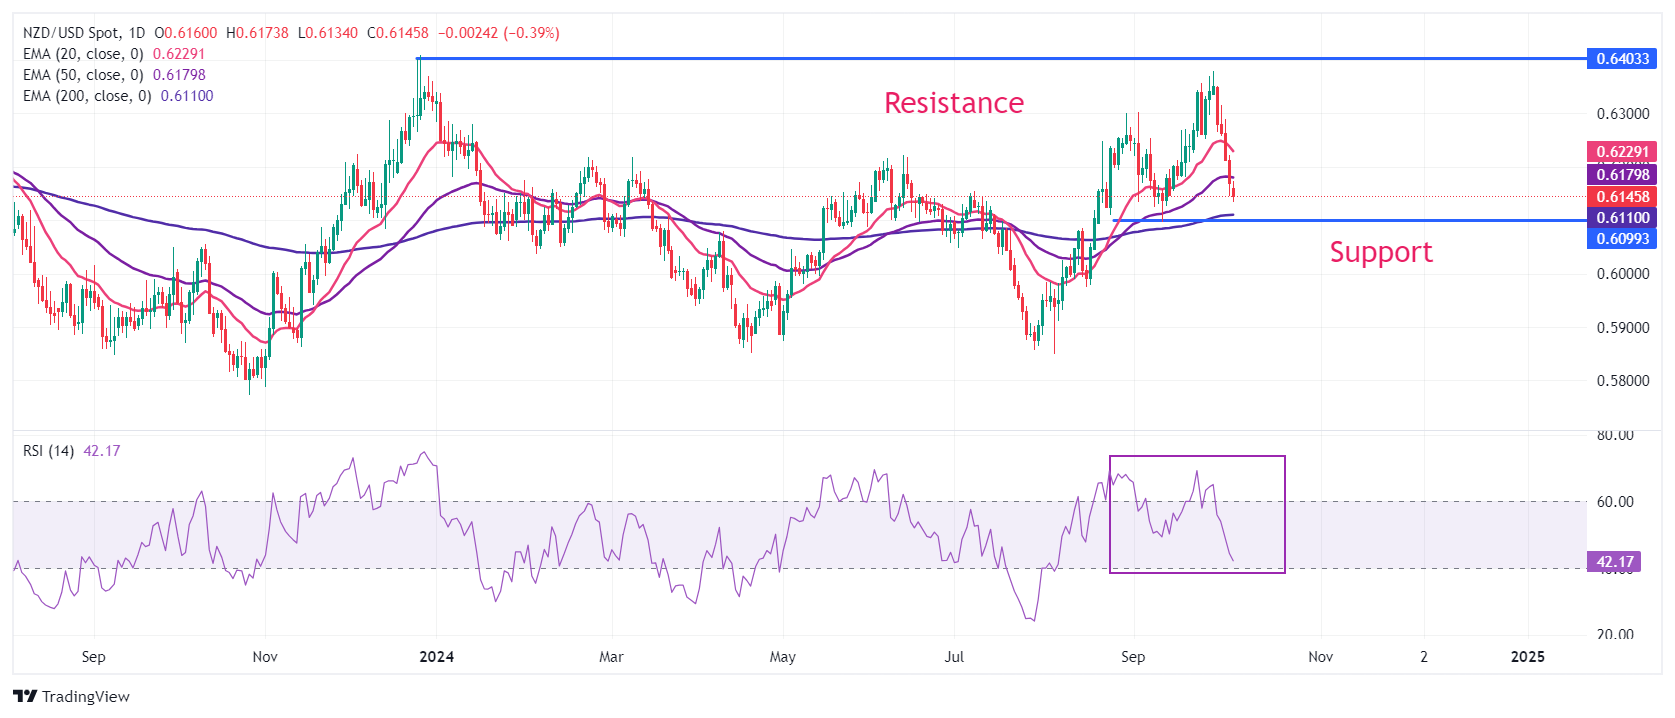
NZD/USD faces a sharp sell-off after failing to recapture the yearly high of 0.6410. The Kiwi asset extends its downside below the 20-and 50-day Exponential Moving Averages (EMAs), which trade around 0.6230 and 0.6180, respectively.
The 14-day Relative Strength Index (RSI) declines toward 40.00, suggesting a weakening of momentum.
More downside would appear if the pair breaks below the horizontal support plotted from September 11 low around 0.6100. The asset would decline further towards May 3 high of 0.6046 and the psychological support of 0.6000 if it breaks below September 11 low.
On the flip side, a reversal move above the 20-day EMA at 0.6230 will drive the asset towards September 3 high of 0.6302 and September 30 high near 0.6380.
NZD/USD daily chart
New Zealand Dollar FAQs
The New Zealand Dollar (NZD), also known as the Kiwi, is a well-known traded currency among investors. Its value is broadly determined by the health of the New Zealand economy and the country’s central bank policy. Still, there are some unique particularities that also can make NZD move. The performance of the Chinese economy tends to move the Kiwi because China is New Zealand’s biggest trading partner. Bad news for the Chinese economy likely means less New Zealand exports to the country, hitting the economy and thus its currency. Another factor moving NZD is dairy prices as the dairy industry is New Zealand’s main export. High dairy prices boost export income, contributing positively to the economy and thus to the NZD.
The Reserve Bank of New Zealand (RBNZ) aims to achieve and maintain an inflation rate between 1% and 3% over the medium term, with a focus to keep it near the 2% mid-point. To this end, the bank sets an appropriate level of interest rates. When inflation is too high, the RBNZ will increase interest rates to cool the economy, but the move will also make bond yields higher, increasing investors’ appeal to invest in the country and thus boosting NZD. On the contrary, lower interest rates tend to weaken NZD. The so-called rate differential, or how rates in New Zealand are or are expected to be compared to the ones set by the US Federal Reserve, can also play a key role in moving the NZD/USD pair.
Macroeconomic data releases in New Zealand are key to assess the state of the economy and can impact the New Zealand Dollar’s (NZD) valuation. A strong economy, based on high economic growth, low unemployment and high confidence is good for NZD. High economic growth attracts foreign investment and may encourage the Reserve Bank of New Zealand to increase interest rates, if this economic strength comes together with elevated inflation. Conversely, if economic data is weak, NZD is likely to depreciate.
The New Zealand Dollar (NZD) tends to strengthen during risk-on periods, or when investors perceive that broader market risks are low and are optimistic about growth. This tends to lead to a more favorable outlook for commodities and so-called ‘commodity currencies’ such as the Kiwi. Conversely, NZD tends to weaken at times of market turbulence or economic uncertainty as investors tend to sell higher-risk assets and flee to the more-stable safe havens.
Recommended Articles


