


EUR/USD Price Forecast: Flat lines below 1.1200 ahead of German consumer inflation data
- EUR/USD lacks any firm intraday direction and remains confined in a multi-day-old range.
- The mixed technical setup warrants caution before positioning for the near-term trajectory.
- Traders look to the flash German CPI for some impetus ahead of Fed Chair Powell’s speech.
The EUR/USD pair struggles to capitalize on Friday's modest rebound from the 1.1125-1.1120 support area and kicks off the new week on a subdued note. Spot prices currently trade around the 1.1160 area, nearly unchanged for the day, as traders keenly await the release of the flash German consumer inflation figures and the Federal Reserve (Fed) Chair Jerome Powell's speech for some fresh impetus.
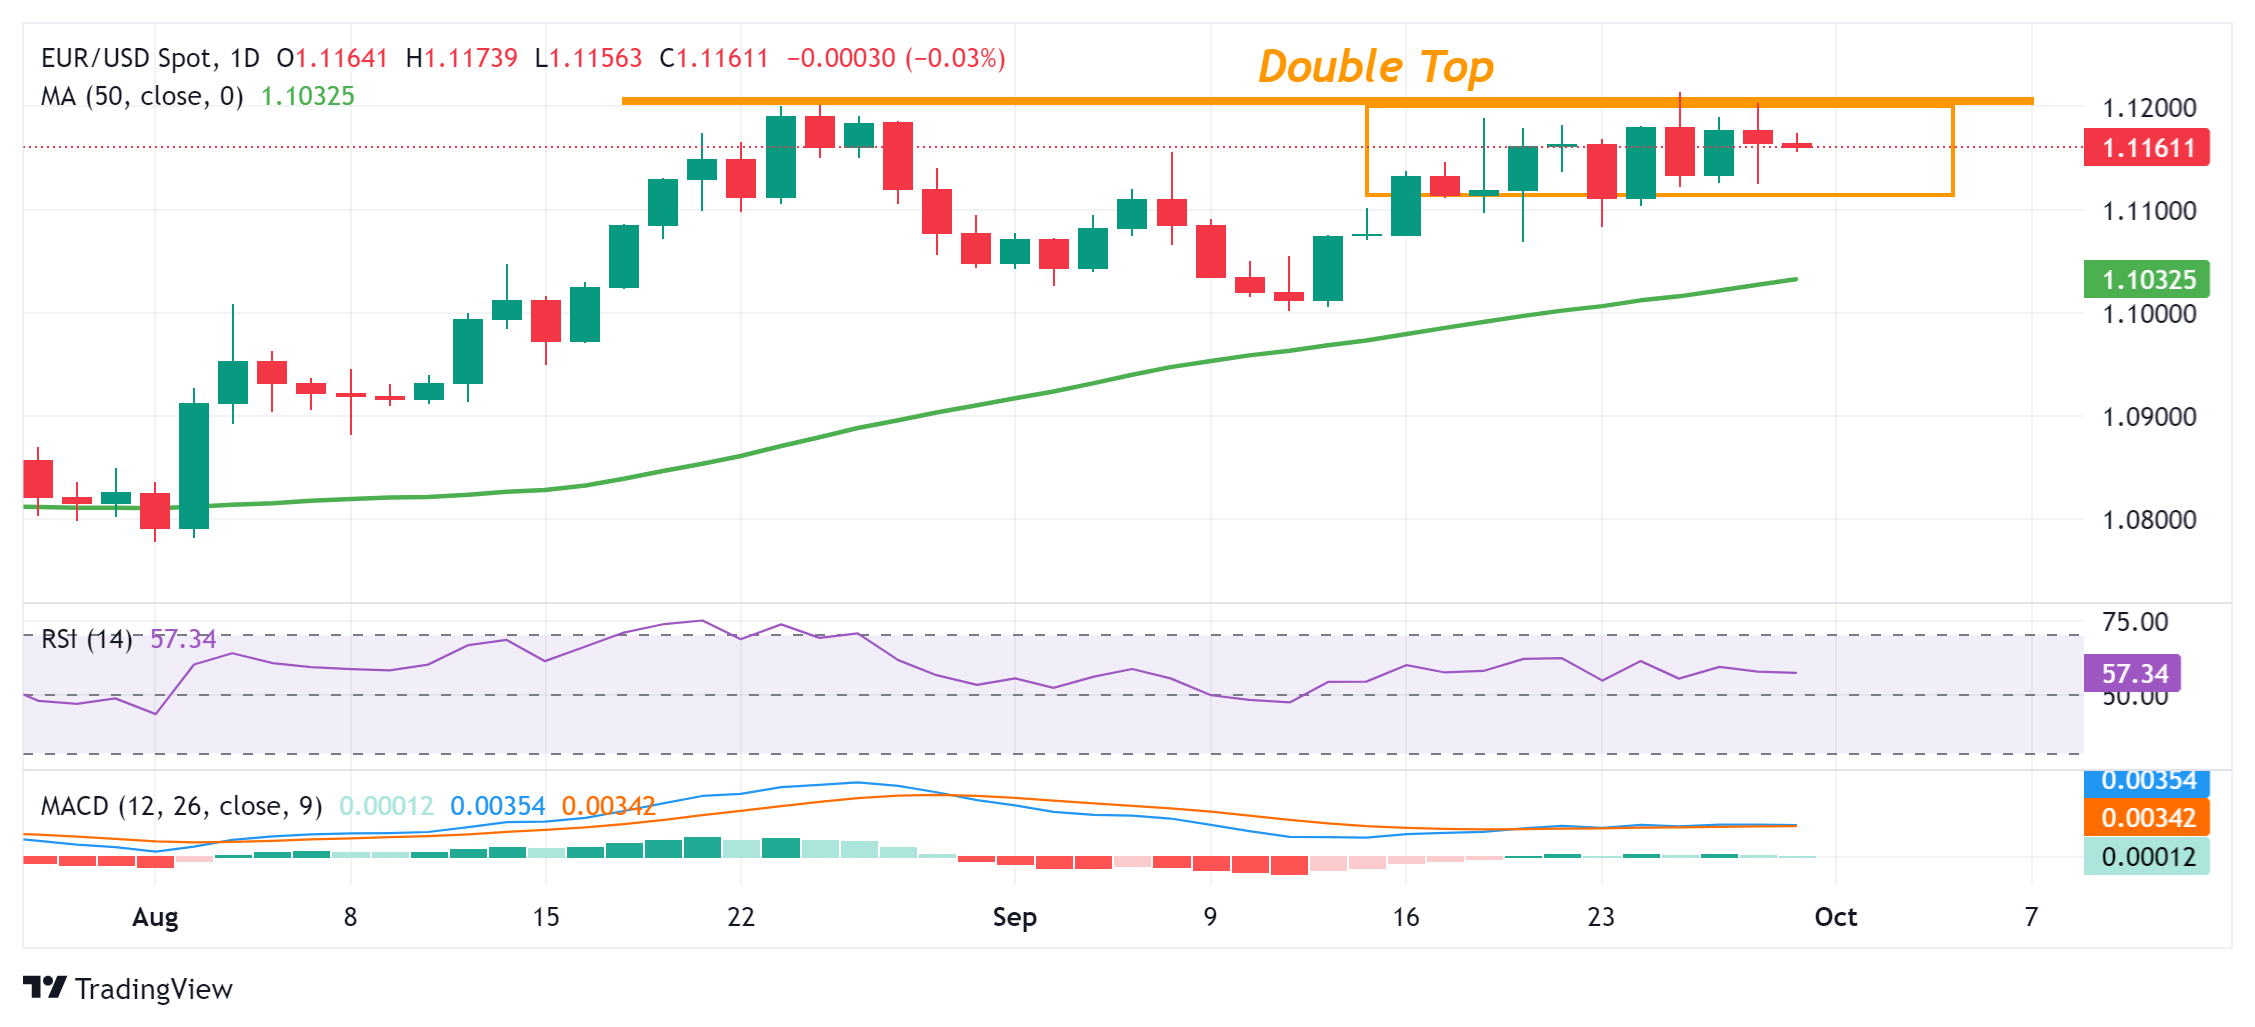
From a technical perspective, the EUR/USD pair remains confined in a multi-day-old trading band. Against the backdrop of the recovery from the 1.1000 psychological mark, or the monthly low, this range-bounce price action might be categorized as a bullish consolidation phase. This, along with positive oscillators on the daily chart, suggests that the path of least resistance for spot prices remains to the upside.
That said, the recent repeated failures to build on the momentum or find acceptance above the 1.1200 round figure constitute the formation of a bearish double-top pattern and warrant some caution for bullish traders. This makes it prudent to wait for a sustained breakout through the aforementioned short-term trading range before confirming and positioning for the next leg of a directional move for the EUR/USD pair.
In the meantime, the 1.1200 mark might continue to act as an immediate hurdle ahead of the 1.1215 region, or a 14-month peak touched last Wednesday. Some follow-through buying will be seen as a fresh trigger for bulls and lift the EUR/USD pair to the 1.1275 region, or the July 2023 high. The momentum could extend beyond the 1.1300 mark, towards the 1.1335 region en route to the 1.1375 area and the 1.1400 round figure.
On the flip side, weakness below the 1.1125-1.1120 immediate support could drag the EUR/USD pair below the 1.1100 mark, towards testing last week's swing low, around the 1.1085-1.1080 zone. The subsequent fall could expose the 50-day Simple Moving Average (SMA), near the 1.1030 zone before spot prices eventually drop to the 1.1000 mark, which if broken will shift the near-term bias in favor of bearish traders.
EUR/USD daily chart
Economic Indicator
Consumer Price Index (YoY)
The Consumer Price Index (CPI), released by the German statistics office Destatis on a monthly basis, measures the average price change for all goods and services purchased by households for consumption purposes. The CPI is the main indicator to measure inflation and changes in purchasing trends. The YoY reading compares prices in the reference month to a year earlier. Generally, a high reading is bullish for the Euro (EUR), while a low reading is bearish.
Read more.Next release: Mon Sep 30, 2024 12:00 (Prel)
Frequency: Monthly
Consensus: -
Previous: 1.9%
Source: Federal Statistics Office of Germany
Recommended Articles


