EUR/GBP Price Analysis: Sellers hit the gas and take further ground

Source Fxstreet
  • EUR/GBP weakens further, and buying pressure continues to retreat.
  • The RSI is moving dangerously near the oversold threshold.
  • The 0.8380 presents a strong barrier against the sellers.

In Friday's session, the EUR/GBP pair continued to decline, losing 0.15% to close at 0.8385. The bearish outlook persists, as selling pressure intensifies and technical indicators signal a negative trend.

Looking at the technical outlook, the Relative Strength Index (RSI) has fallen to 35, moving deeper into the negative area. This sharp decline indicates that selling pressure is rising. Furthermore, the Moving Average Convergence Divergence (MACD) histogram remains red and rising, also suggesting increasing bearish momentum. 

EUR/GBP daily chart
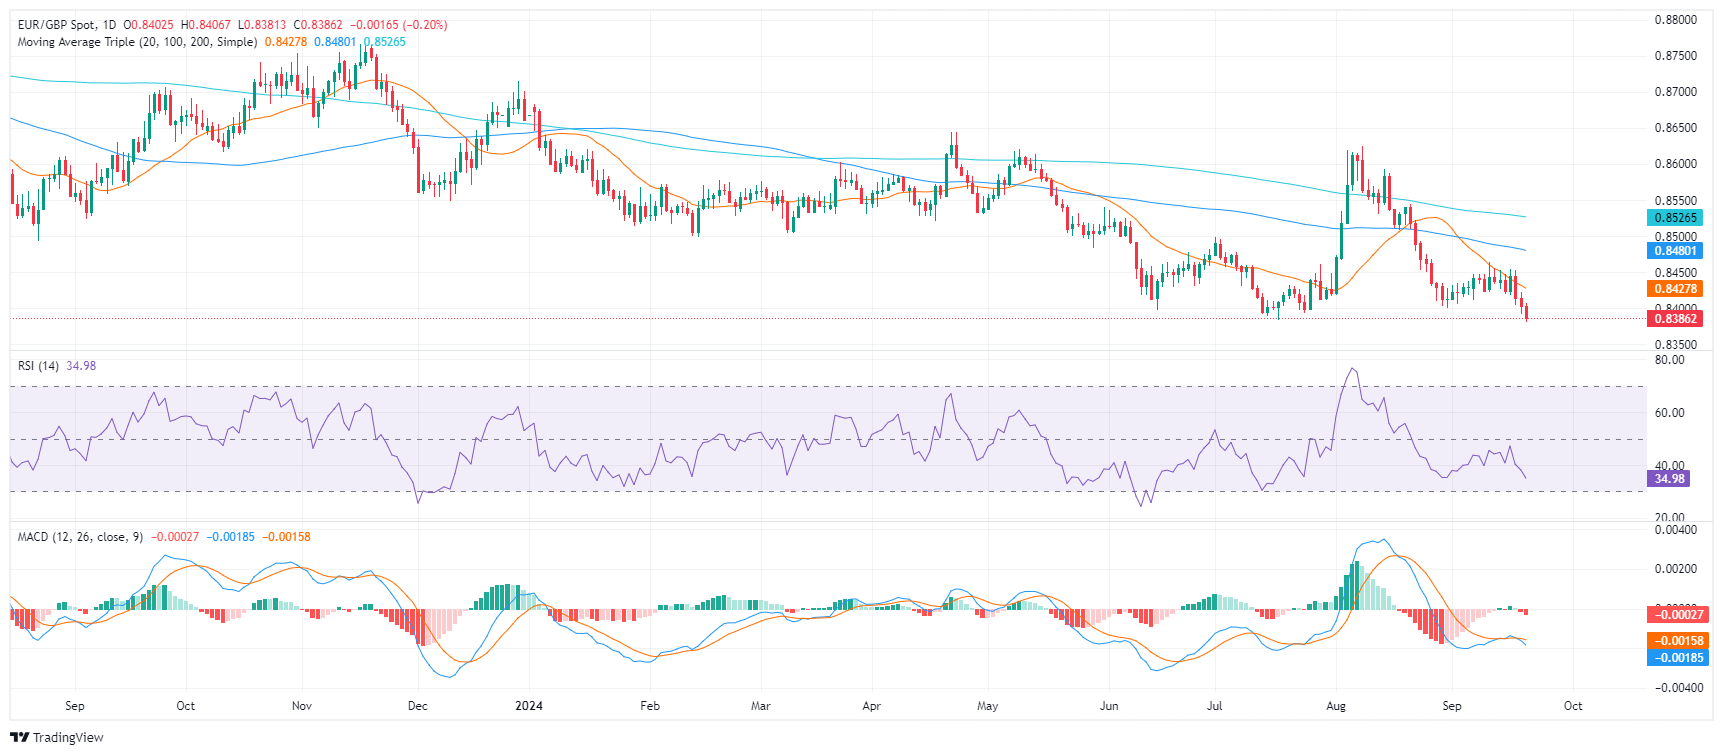
Based on the current technical picture, the EUR/GBP pair is likely to continue its downward trajectory. Support levels can be found at 0.8380, 0.8350, and 0.8330. If the pair breaks below 0.8380, it could signal a deeper decline toward 0.8350. Resistance levels can be found at 0.8420 (20-day Simple Moving Average (SMA)), 0.8430, and 0.8440. A break above 0.8440 could indicate a potential trend reversal.

Overall, the technical indicators and recent price action suggest that the bearish momentum is likely to continue in the short term. As bears point their cannons towards 0.8380, a break below would mark a fresh yearly low, which would confirm a bearish outlook.


Disclaimer: For information purposes only. Past performance is not indicative of future results.
placeholder
Bitcoin CME gaps at $35,000, $27,000 and $21,000, which one gets filled first?Prioritize filling the $27,000 gap and even try higher.
Author  FXStreet
Aug 21, 2023
Prioritize filling the $27,000 gap and even try higher.
placeholder
Natural Gas sinks to pivotal level as China’s demand slumpsNatural Gas price (XNG/USD) edges lower and sinks to $2.56 on Monday, extending its losing streak for the fifth day in a row. The move comes on the back of China cutting its Liquified Natural Gas (LNG) imports after prices rose above $3.0 in June. It
Author  FXStreet
Jul 01, Mon
Natural Gas price (XNG/USD) edges lower and sinks to $2.56 on Monday, extending its losing streak for the fifth day in a row. The move comes on the back of China cutting its Liquified Natural Gas (LNG) imports after prices rose above $3.0 in June. It
placeholder
Nvidia vs. Broadcom: Which Is the Better AI Chip Stock to Own in 2025?When it came to artificial intelligence (AI) infrastructure in 2024, Nvidia (NASDAQ: NVDA) reigned supreme.
Author  The Motley Fool
Dec 19, Thu
When it came to artificial intelligence (AI) infrastructure in 2024, Nvidia (NASDAQ: NVDA) reigned supreme.
placeholder
American Express: Buy, Sell, or Hold?American Express (NYSE: AXP) shares have been on an absolute tear. In the past 14 months, they have catapulted 100% higher (as of Dec. 16), consistently hitting fresh all-time high
Author  The Motley Fool
23 hours ago
American Express (NYSE: AXP) shares have been on an absolute tear. In the past 14 months, they have catapulted 100% higher (as of Dec. 16), consistently hitting fresh all-time high
placeholder
US Dollar hits fresh two-year high ahead of PCE inflationThe US Dollar (USD) retreats slightly on Friday, with the DXY Index trading at around 108.20 after eking out another fresh two-year high of 108.55 during the Asian-Pacific trading session. The move was supported by rising US Treasury yields, widening
Author  FXStreet
23 hours ago
The US Dollar (USD) retreats slightly on Friday, with the DXY Index trading at around 108.20 after eking out another fresh two-year high of 108.55 during the Asian-Pacific trading session. The move was supported by rising US Treasury yields, widening
Related Instrument
goTop
quote