GBP/USD Price Forecast: Holds steady as US data leaves Fed rate cut uncertainty
- GBP/USD remains upward biased but struggles to clear key resistance at 1.3200, with YTD high of 1.3266 looming.
- A pullback below 1.3150 could see the pair test support at 1.3087, with further downside to 1.3044 and the 50-DMA at 1.2925.
- Traders' rate cut expectations fluctuate, with a 43% chance for a 50-bps cut and 57% for a 25-bps cut.
The GBP/USD seesawed during the North American session as softer US jobs data increased. This kept investors uncertain of a 50—or 25-basis-point rate cut by the Fed at the September 17-18 meeting. The pair trades at 1.3172, virtually unchanged.
Federal Reserve interest rate expectations fluctuated after the US Nonfarm Payrolls report. Traders of fed funds futures increased their bets to a 70% chance for a 50-bps cut, yet they trimmed those odds. At the time of writing, the chances are 43%, while for a quarter of a percentage point cut, they are at 57%.
GBP/USD Price Forecast: Technical outlook
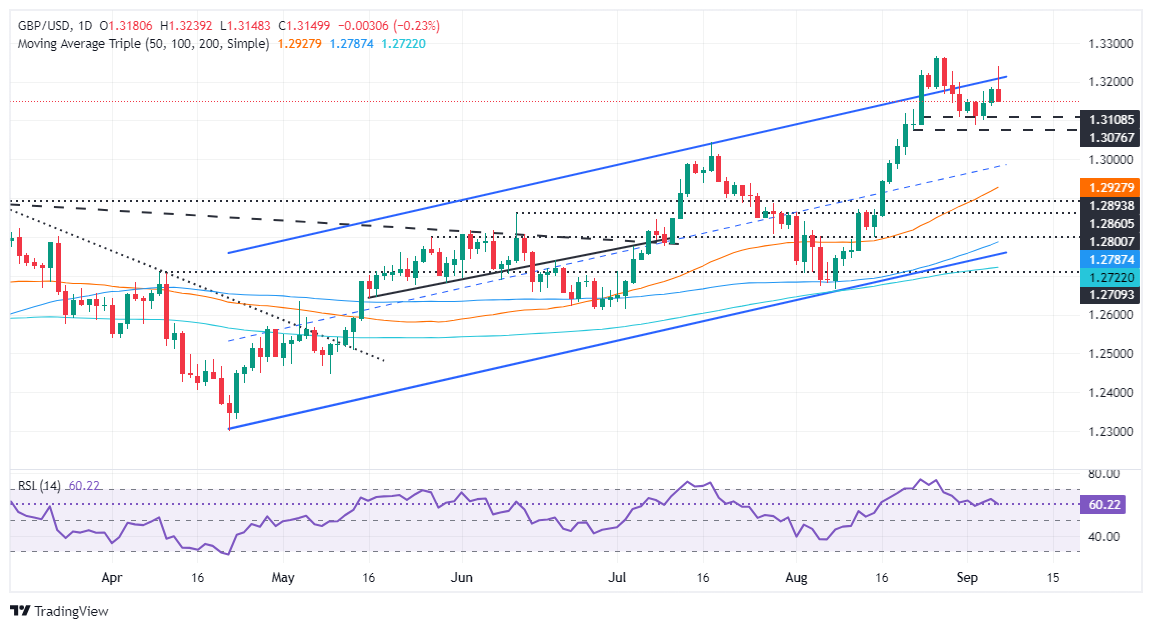
Given the backdrop, the technical view is that the GBP/USD is upward biased but failed to clear the year-to-date (YTD) peak of 1.3266, which exacerbated a dip below 1.3200 after hitting a high of 1.3239 on Friday.
With that in mind and buying momentum fading as shown by the Relative Strength Index (RSI), the GBP/USD could be headed for a pullback.
If GBP/USD retreats below 1.3150, the next support could be the September 3 low of 1.3087. On further weakness, the pair could aim toward the July 17 high at 1.3044 before moving towards the 50-day moving average (DMA) at 1.2925.
Conversely, if buyers stepped in and pushed prices above 1.3200, the next resistance would be the YTD high at 1.3266.
GBP/USD Price Action – Daily Chart

British Pound PRICE Today
The table below shows the percentage change of British Pound (GBP) against listed major currencies today. British Pound was the strongest against the Australian Dollar.
| USD | EUR | GBP | JPY | CAD | AUD | NZD | CHF | |
|---|---|---|---|---|---|---|---|---|
| USD | 0.12% | 0.20% | -0.64% | 0.29% | 0.59% | 0.38% | -0.09% | |
| EUR | -0.12% | 0.08% | -0.76% | 0.18% | 0.49% | 0.23% | -0.21% | |
| GBP | -0.20% | -0.08% | -0.83% | 0.14% | 0.41% | 0.17% | -0.31% | |
| JPY | 0.64% | 0.76% | 0.83% | 0.95% | 1.20% | 0.96% | 0.53% | |
| CAD | -0.29% | -0.18% | -0.14% | -0.95% | 0.29% | 0.09% | -0.47% | |
| AUD | -0.59% | -0.49% | -0.41% | -1.20% | -0.29% | -0.23% | -0.71% | |
| NZD | -0.38% | -0.23% | -0.17% | -0.96% | -0.09% | 0.23% | -0.44% | |
| CHF | 0.09% | 0.21% | 0.31% | -0.53% | 0.47% | 0.71% | 0.44% |
The heat map shows percentage changes of major currencies against each other. The base currency is picked from the left column, while the quote currency is picked from the top row. For example, if you pick the British Pound from the left column and move along the horizontal line to the US Dollar, the percentage change displayed in the box will represent GBP (base)/USD (quote).

