USD/JPY Price Prediction: Bouncing from close to August 5 lows

Source Fxstreet
  • USD/JPY is rebounding from key support near the August 5 lows. 
  • It is forming a bullish candlestick although it is not possible to be certain until the current 4-hour period ends. 
  • The trend remains bearish although a correction higher looks likely. 

USD/JPY has fallen close to the August 5 lows and bounced. It is forming a large, bullish Hammer Japanese candlestick pattern on the 4-hour chart – if the current period ends with the pattern intact it could signal the start of a substantial pull-back or correction higher. 

USD/JPY 4-hour Chart 
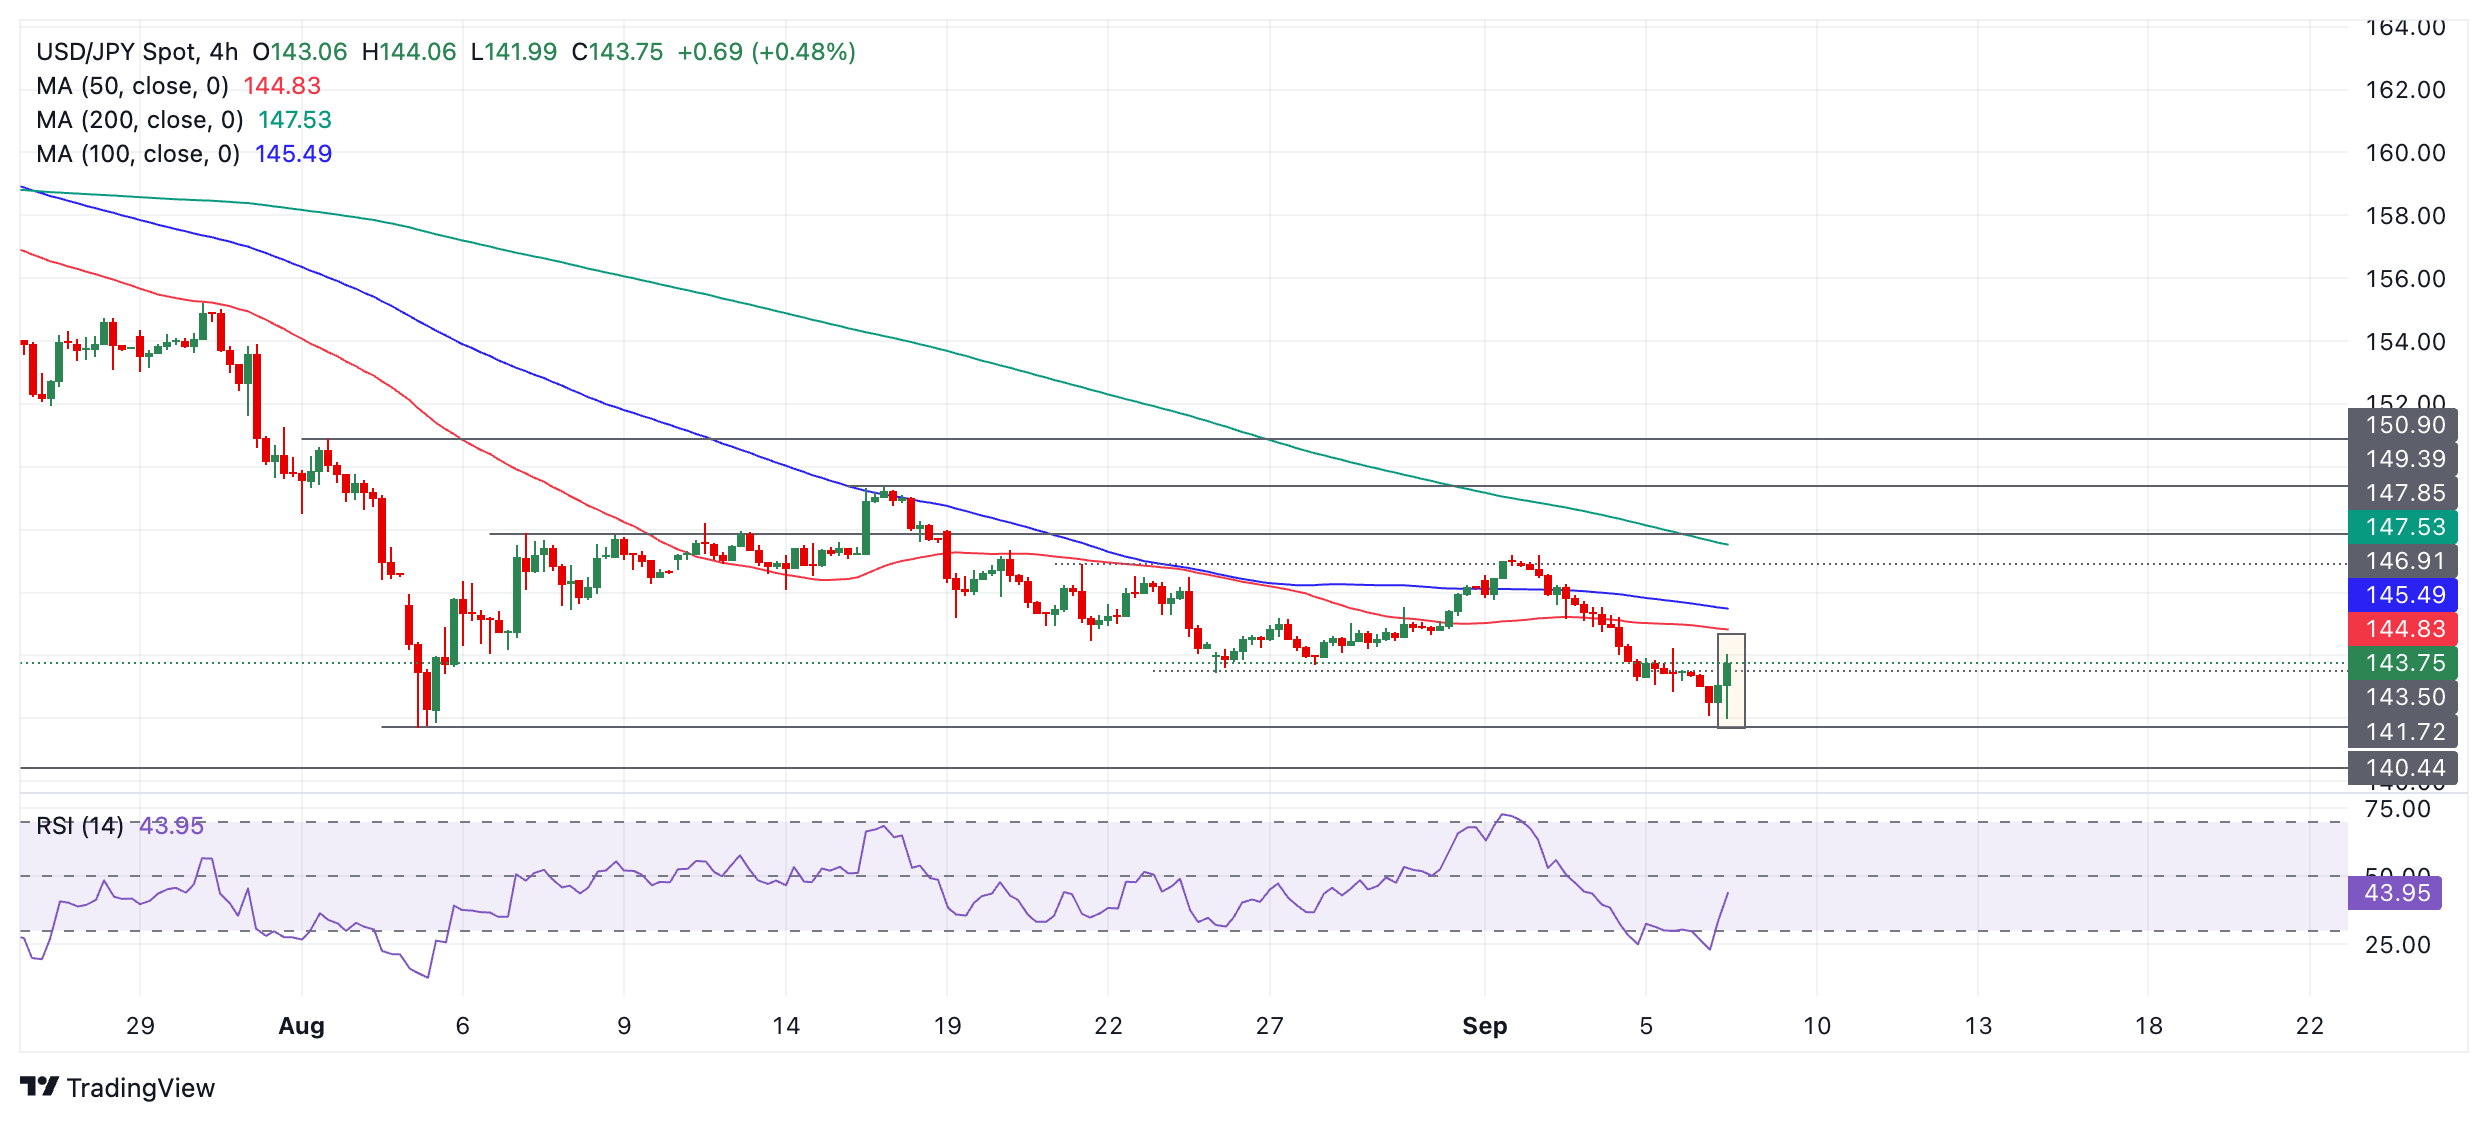
The Relative Strength Index (RSI) momentum indicator has exited oversold, giving a buy signal and indicating a greater chance of a counter-trend correction evolving. The RSI has also itself formed a double bottom pattern when looking at the previous time it was oversold on September 4. This is further evidence strengthening the case for a bullish reaction. 

The short-term trend remains down, however, and it is too early to be sure that the pair is reversing the trend fully. The correction higher could soon run out of steam, leading the pair to recapitulate and start falling in line with the trend. It is a major tenet of technical analysis that “the trend is your friend” and the odds favor a continuation lower. 

However, it would require a break below the August 5 lows at 141.69 to confirm a continuation lower. Such a move would probably then fall to support at 140.44 initially, the December 2023 lows.


Disclaimer: For information purposes only. Past performance is not indicative of future results.
placeholder
What Crypto Whales are Buying For May 2025Crypto whales are making bold moves heading into May 2025, and three tokens are standing out: Ethereum (ETH), Artificial Superintelligence Alliance (FET), and Onyxcoin (XCN).
Author  Beincrypto
Apr 21, Mon
Crypto whales are making bold moves heading into May 2025, and three tokens are standing out: Ethereum (ETH), Artificial Superintelligence Alliance (FET), and Onyxcoin (XCN).
placeholder
Gold price snaps selling off after fresh Trump comments on tariffsGold price (XAU/USD) is turning positive, recovering above the $$3,300 level at the time of writing on Thursday after two days of firm selling pressure since it topped at $3,500 on Tuesday.
Author  FXStreet
Apr 24, Thu
Gold price (XAU/USD) is turning positive, recovering above the $$3,300 level at the time of writing on Thursday after two days of firm selling pressure since it topped at $3,500 on Tuesday.
placeholder
Gold price surges past $3,300 on trade jitters, yield slump reviving haven demandGold price snapped two days of losses on Thursday and rose $50, or more than 1.50%, amid renewed concerns about the US-China trade war.
Author  FXStreet
Yesterday 03: 51
Gold price snapped two days of losses on Thursday and rose $50, or more than 1.50%, amid renewed concerns about the US-China trade war.
placeholder
Gold price consolidates in a range; bulls have the upper hand while above $3,300Gold price (XAU/USD) struggles to capitalize on the previous day's move higher and oscillates in a narrow trading band during the Asian session on Friday amid mixed fundamental cues.
Author  FXStreet
Yesterday 03: 53
Gold price (XAU/USD) struggles to capitalize on the previous day's move higher and oscillates in a narrow trading band during the Asian session on Friday amid mixed fundamental cues.
placeholder
Gold edges down amid clash over status of US-China trade talksGold price is on the back foot on Friday, almost erasing all of Thursday’s gains, and looks set to close off this week in the red.
Author  FXStreet
20 hours ago
Gold price is on the back foot on Friday, almost erasing all of Thursday’s gains, and looks set to close off this week in the red.
Related Instrument
goTop
quote