USD/CAD Price Analysis: Reaches critical point at ceiling of three-month range

Source Fxstreet
  • USD/CAD has reached the top of a range it has been trading in for over three months. 
  • It could either breakout higher or pull back down and start descending back down to the bottom of the range.

USD/CAD has risen to the top of the range it has been trading in since the middle of April. It is at a critical point – a decisive breakout higher would signal a new uptrend; a reversal, however, might signal the continuation of the sideways trend it has been in for the last over three months. Given the “trend is your friend” the odds marginally favor a continuation of the sideways mode. 

USD/CAD Daily Chart 

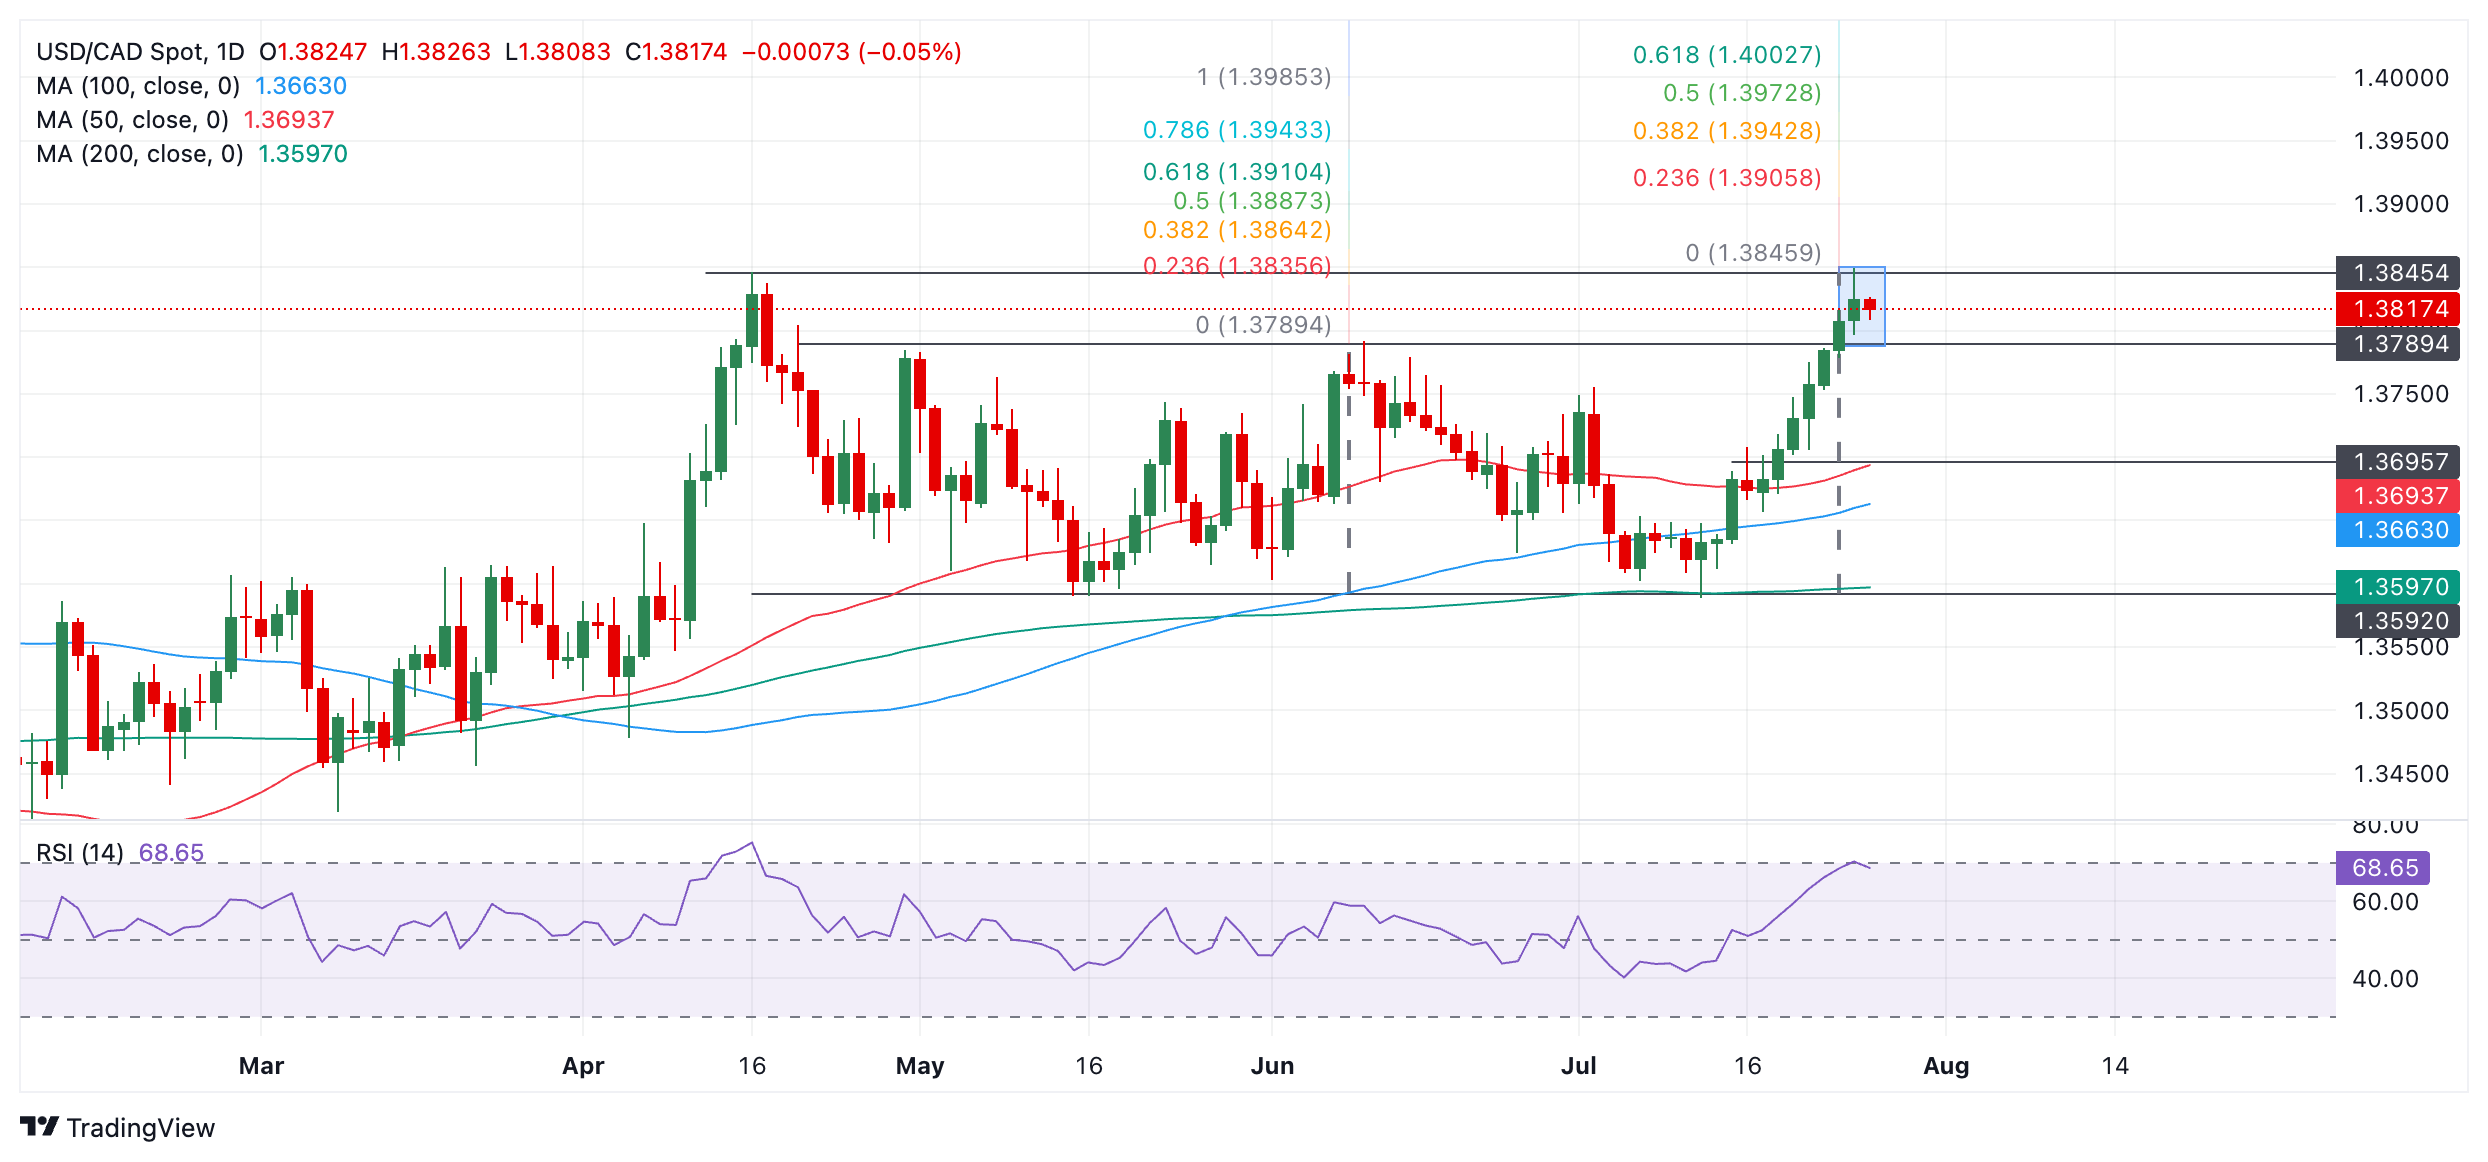
USD/CAD formed a bearish Shooting Star reversal candlestick on Thursday. If the following day – Friday – ends as a bearish red candlestick it will add confirmation to the pattern and suggest a deeper pull back will probably unfold. 

The Relative Strength Index (RSI) entered overbought territory on Thursday during the formation of the Shooting Star. If the RSI ends Friday back below the overbought zone (under 70) it will add evidence of a short-term reversal of the trend. 

A deeper pull back would probably fall to the top of the range-within-the-range at 1.3790 initially. A deeper correction might start falling back down towards the range floor at 1.3592 as the sideways trend extends. 

Alternatively, a break and close on a daily basis above the high of the Shooting Star candlestick at 1.3849 would suggest a breakout of the entire range and extension higher. 

Such a move would be expected to reach an initial target at 1.3910, the 61.8% Fibonacci extension of the range-within-the-range higher. The next target would be at 1.4000, the extension from the broader range using the April 16 high as the top. 


Disclaimer: For information purposes only. Past performance is not indicative of future results.
placeholder
Bitcoin CME gaps at $35,000, $27,000 and $21,000, which one gets filled first?Prioritize filling the $27,000 gap and even try higher.
Author  FXStreet
Aug 21, 2023
Prioritize filling the $27,000 gap and even try higher.
placeholder
Understanding the first crypto market crash of 2024 and what to expect nextThe 365-day MVRV ratio suggests that this crash may be just the beginning. If the ETF is rejected before the second quarter of 2024, it could trigger a sharp correction.
Author  FXStreet
Jan 04, Thu
The 365-day MVRV ratio suggests that this crash may be just the beginning. If the ETF is rejected before the second quarter of 2024, it could trigger a sharp correction.
placeholder
Natural Gas sinks to pivotal level as China’s demand slumpsNatural Gas price (XNG/USD) edges lower and sinks to $2.56 on Monday, extending its losing streak for the fifth day in a row. The move comes on the back of China cutting its Liquified Natural Gas (LNG) imports after prices rose above $3.0 in June. It
Author  FXStreet
Jul 01, Mon
Natural Gas price (XNG/USD) edges lower and sinks to $2.56 on Monday, extending its losing streak for the fifth day in a row. The move comes on the back of China cutting its Liquified Natural Gas (LNG) imports after prices rose above $3.0 in June. It
placeholder
Top XRP Ledger Dev Calls Out Ripple’s Leadership On Smart Contract PivotWietse Wind, founder of XRP Labs—one of the leading independent XRP Ledger development companies—has published an open letter to the community and Ripple.
Author  Bitcoinist
Sep 04, Wed
Wietse Wind, founder of XRP Labs—one of the leading independent XRP Ledger development companies—has published an open letter to the community and Ripple.
placeholder
Bitcoin (BTC) Price Struggles Put Short-Term Holders at a DisadvantageIn recent months, a cohort of Bitcoin (BTC) holders has been notably affected by the coin’s struggle to stabilize above $70,000. This group comprises short-term holders (STHs) — investors who have held the asset for less than 155 days.
Author  Beincrypto
Sep 06, Fri
In recent months, a cohort of Bitcoin (BTC) holders has been notably affected by the coin’s struggle to stabilize above $70,000. This group comprises short-term holders (STHs) — investors who have held the asset for less than 155 days.
Related Instrument
goTop
quote