NZD/USD Price Analysis: Pair gave up and lost the 0.6070 vital area

Source Fxstreet
  • NZD/USD trudges below the 0.6070 level, marking its worst week since January.
  • The pair closed at 0.6010, indicating a weekly loss of approximately 1.80%.
  • NZD/USD remains under the key SMA of 20, 100, and 200 days, pointing to a sustained bearish bias.

In Friday's session, the NZD/USD sustained its downward momentum, dropping by 0.65% to touch 0.6010. The pair's failure to reclaim the 0.6070 level resulted in a dip to the significant 0.6000 line, consequently closing its worst week since the start of the year with a weekly loss of around 1.80%.

The daily technical indicators also echo this downward trend. The Relative Strength Index (RSI) has decreased further to 36 signaling a continuation of selling pressure. Additionally, the Moving Average Convergence Divergence (MACD) continues to print rising red bars, reaffirming the growing bearish sentiment.

NZD/USD daily chart
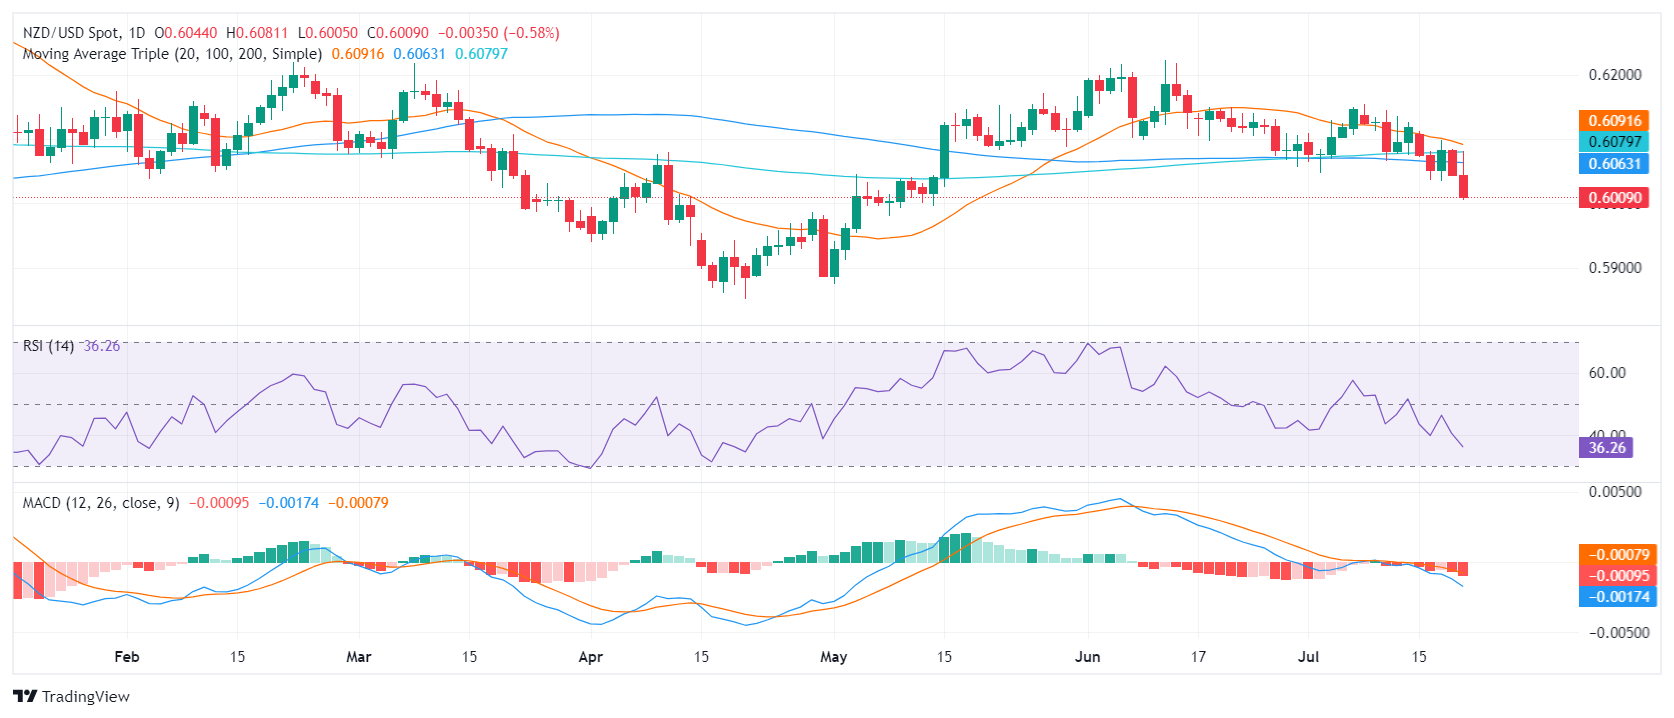
Resistance presently resides at the former support level of 0.6070 and then around 0.6100. On the other hand, strong support is now observed at the formidable 0.6000 line, under which the 0.6450-0.6470 range is visible. Should the bearish tilt maintain its course and lead to a further downturn beneath these levels, it would solidify the bearish narrative.

Disclaimer: For information purposes only. Past performance is not indicative of future results.
placeholder
Copper Long-term forecast: Will Copper Price Expected To Soar In 2023?The price of copper is affected by various of factors. You may wonder how the price of cooper will be in 2023, check out our forecast analysis.
Author  Mitrade
Mar 13, 2023
The price of copper is affected by various of factors. You may wonder how the price of cooper will be in 2023, check out our forecast analysis.
placeholder
Non-farm Payrolls Slightly Beat Expectations, Will Gold Continue to Rise?Gold will rebound in the short-term.
Author  Mitrade
Sep 05, 2023
Gold will rebound in the short-term.
placeholder
Understanding the first crypto market crash of 2024 and what to expect nextThe 365-day MVRV ratio suggests that this crash may be just the beginning. If the ETF is rejected before the second quarter of 2024, it could trigger a sharp correction.
Author  FXStreet
Jan 04, Thu
The 365-day MVRV ratio suggests that this crash may be just the beginning. If the ETF is rejected before the second quarter of 2024, it could trigger a sharp correction.
placeholder
Japanese Yen stands tall near one-month top against USD on hawkish BoJ talksThe Japanese Yen (JPY) rallied to the highest level since early February against its American counterpart on Friday amid bets for an imminent shift in the Bank of Japan's (BoJ) policy stance.
Author  FXStreet
Mar 11, Mon
The Japanese Yen (JPY) rallied to the highest level since early February against its American counterpart on Friday amid bets for an imminent shift in the Bank of Japan's (BoJ) policy stance.
placeholder
Natural Gas sinks to pivotal level as China’s demand slumpsNatural Gas price (XNG/USD) edges lower and sinks to $2.56 on Monday, extending its losing streak for the fifth day in a row. The move comes on the back of China cutting its Liquified Natural Gas (LNG) imports after prices rose above $3.0 in June. It
Author  FXStreet
Jul 01, Mon
Natural Gas price (XNG/USD) edges lower and sinks to $2.56 on Monday, extending its losing streak for the fifth day in a row. The move comes on the back of China cutting its Liquified Natural Gas (LNG) imports after prices rose above $3.0 in June. It
Related Instrument
goTop
quote