EUR/GBP Price Analysis: Signs the downtrend could be resuming

Source Fxstreet
Jul 5, 2024 10:10
  • EUR/GBP forms a two bar reversal pattern and begins descending. 
  • This comes after price has filled a gap on the charts – another reversal sign. 
  • Evidence is building that the correction from the June 14 lows has rolled over and the intermediate downtrend is resuming. 

EUR/GBP is potentially resuming its medium-term downtrend after correcting higher since the June 14 lows. 

EUR/GBP Daily Chart 
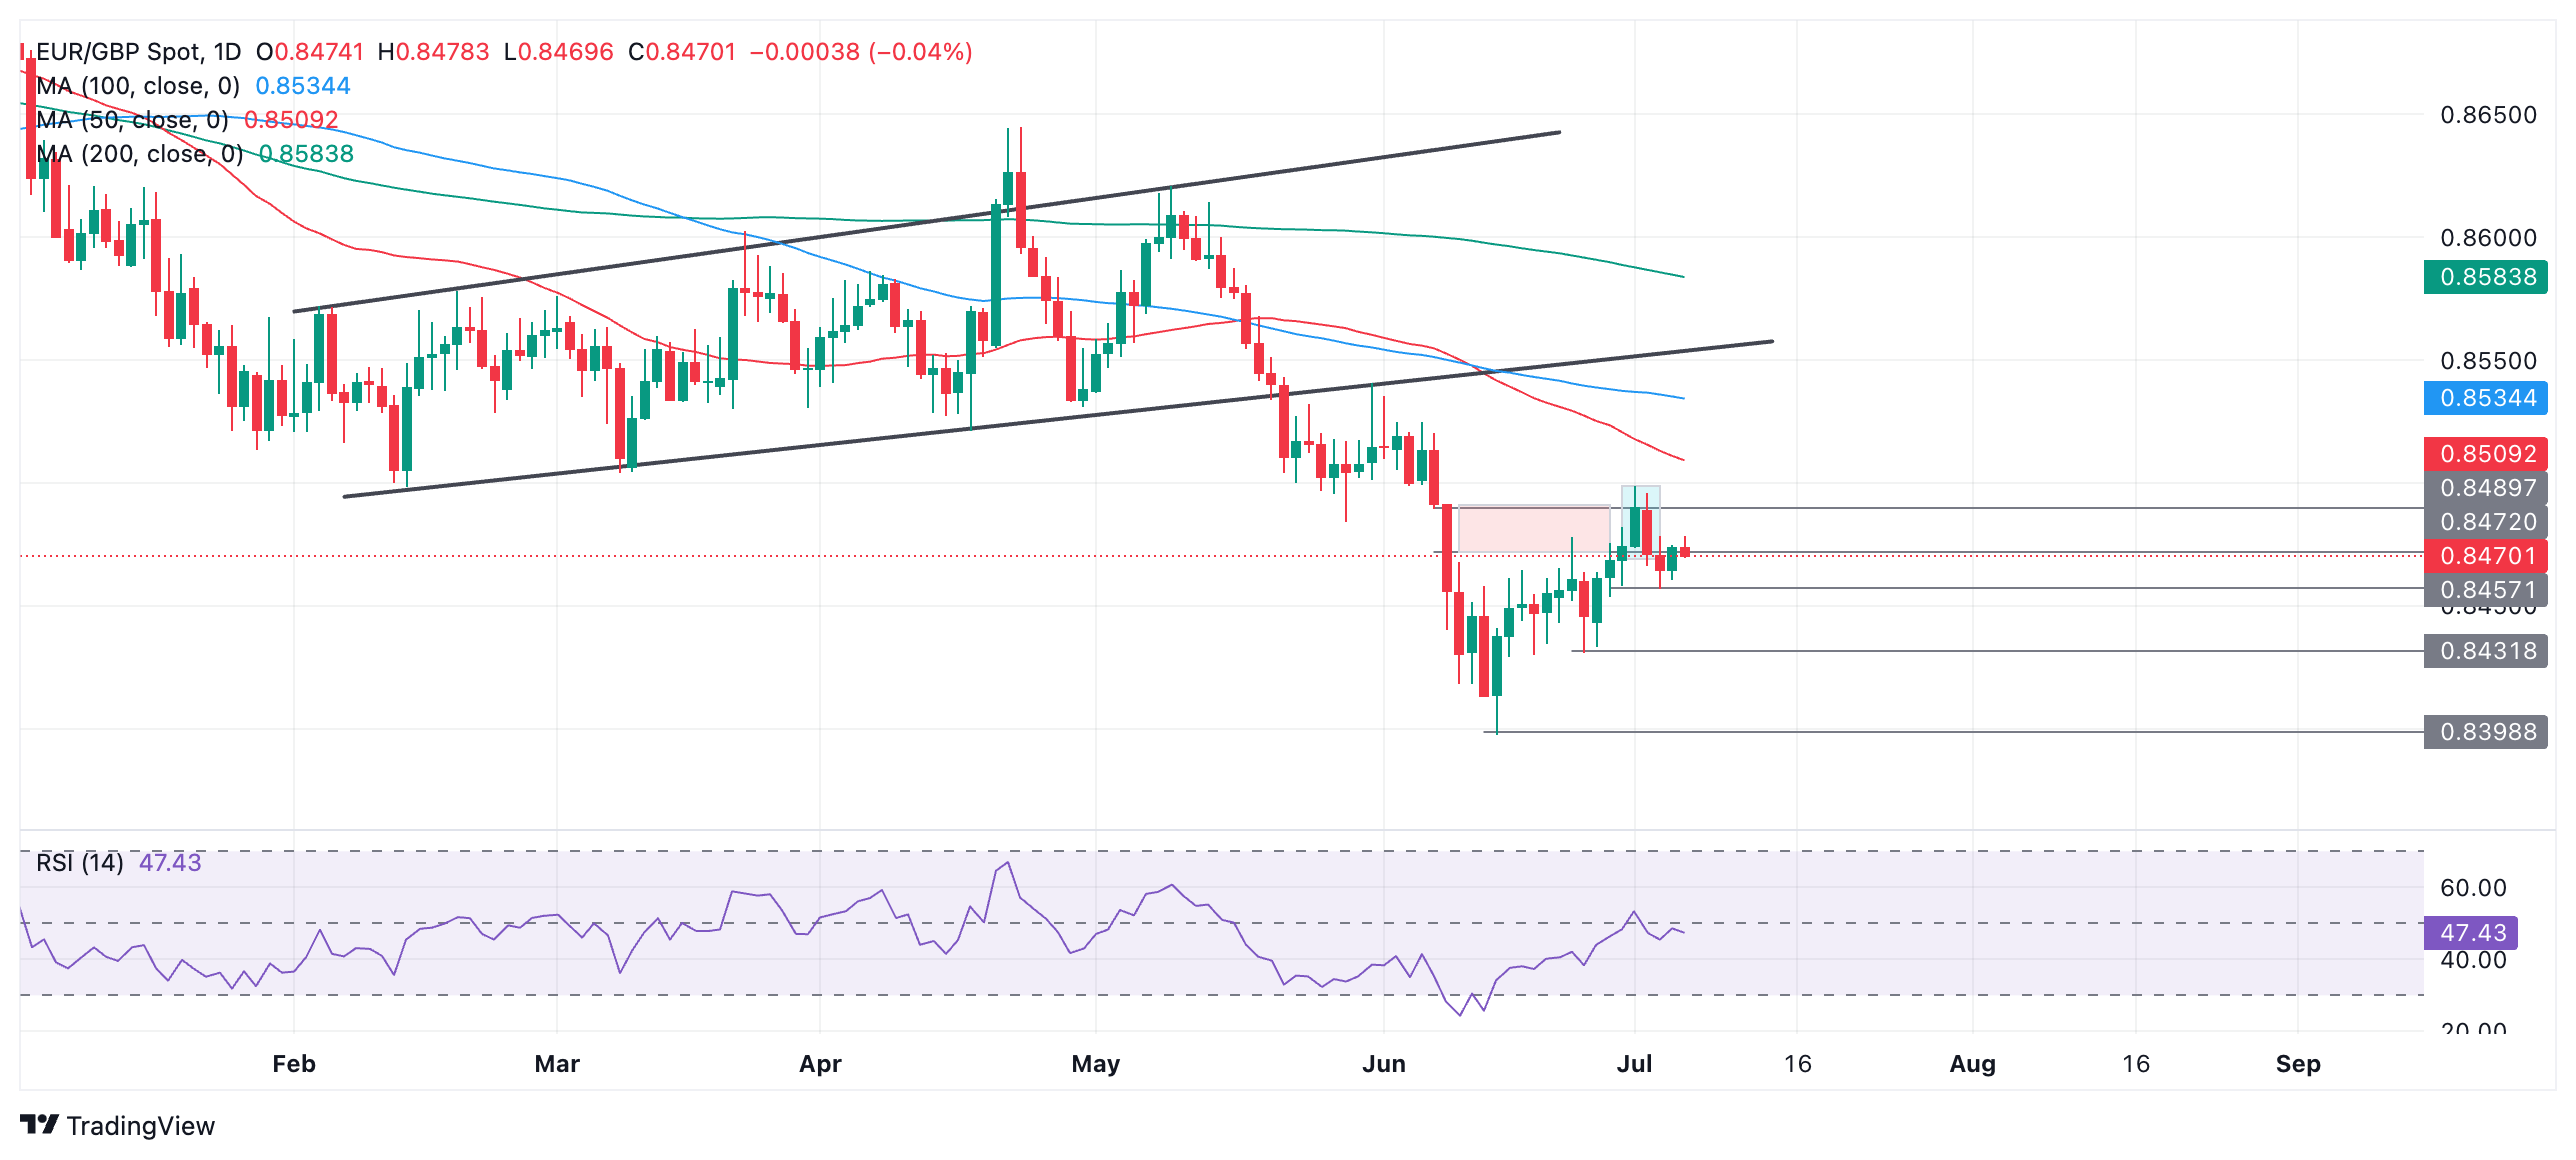
The pair has formed a two-bar reversal pattern at the peak of the correction, on July 1-2 (light blue rectangle) which is a bearish indicator. Two-bar reversals occur when price peaks and forms a green candle which is succeeded by a red candle of a similar shape and size. The fact that the day after the pattern was also bearish is further confirmation. 

EUR/GBP 4-hour Chart
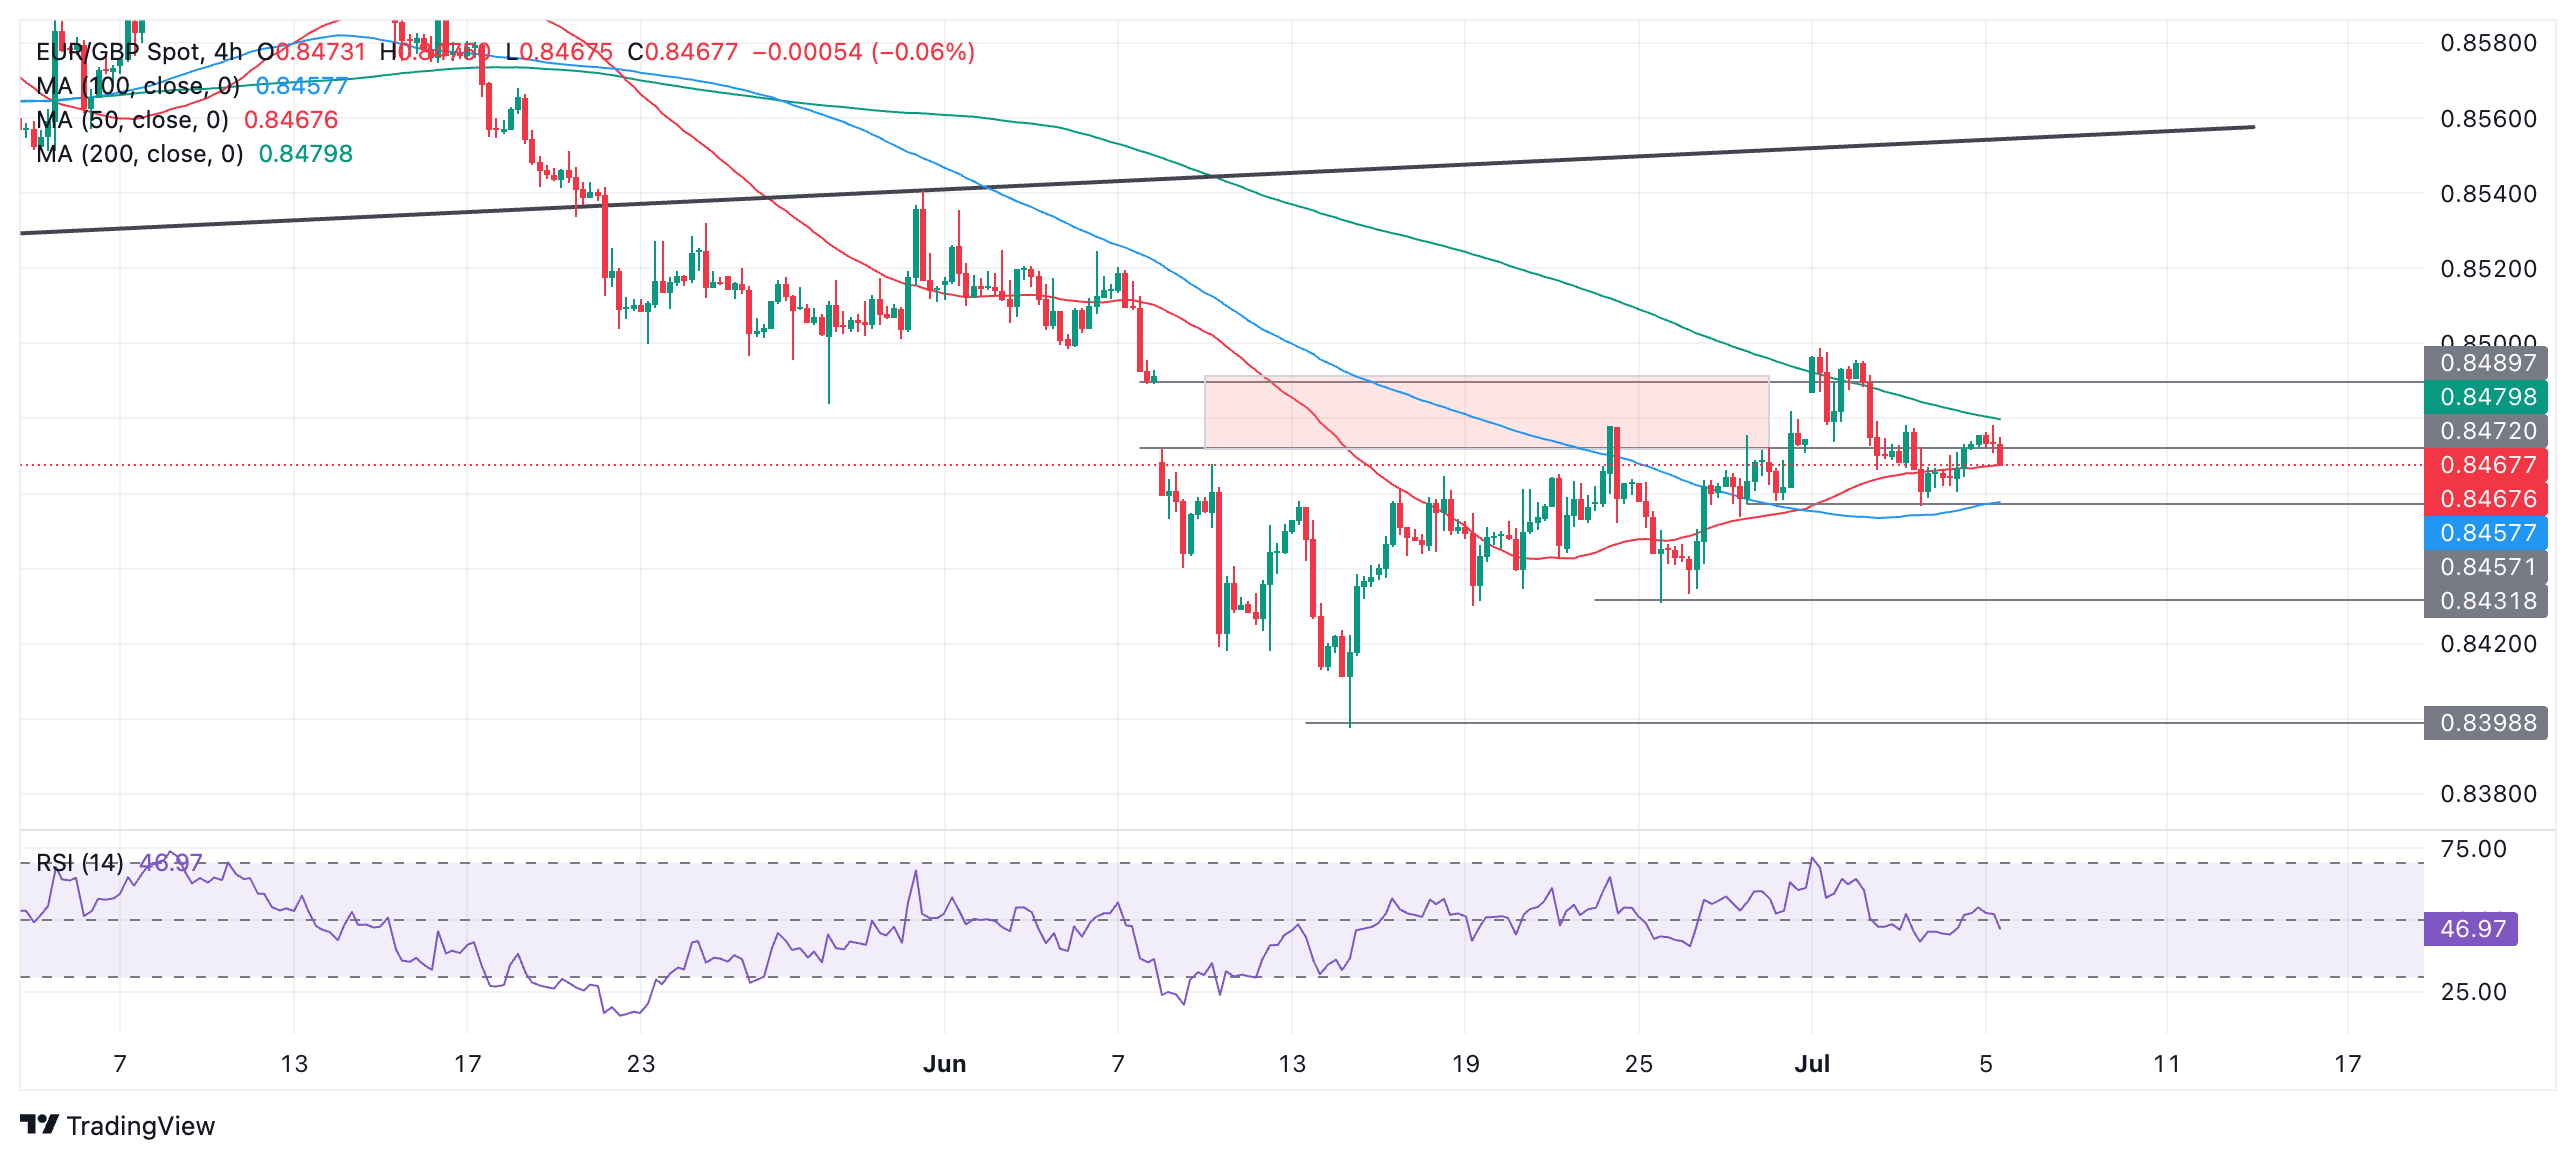


A further indication the dominant downtrend is resuming is that EUR/GBP has filled the price gap that opened between 0.8472 and 0.8490 (red shaded area). This gap can be seen on the 4-hour chart above.

It is said prices are often drawn to fill gaps and now they have there is more chance the downtrend will resume. 

A break below 0.8458 (July 3 and June 28 low) would provide added bearish confirmation. 

The next downside target would be the 0.8431 June 25 low. 

Alternatively if the pair recovers, and breaks above 0.8499 (July 1) it could indicate a continuation of the correction higher, with the 50-day Simple Moving Average at 0.8517 providing resistance and the next target to the upside. 


Disclaimer: For information purposes only. Past performance is not indicative of future results.
placeholder
Copper Long-term forecast: Will Copper Price Expected To Soar In 2023?The price of copper is affected by various of factors. You may wonder how the price of cooper will be in 2023, check out our forecast analysis.
Author  Mitrade
The price of copper is affected by various of factors. You may wonder how the price of cooper will be in 2023, check out our forecast analysis.
placeholder
Bitcoin CME gaps at $35,000, $27,000 and $21,000, which one gets filled first?Prioritize filling the $27,000 gap and even try higher.
Author  FXStreet
Prioritize filling the $27,000 gap and even try higher.
placeholder
Understanding the first crypto market crash of 2024 and what to expect nextThe 365-day MVRV ratio suggests that this crash may be just the beginning. If the ETF is rejected before the second quarter of 2024, it could trigger a sharp correction.
Author  FXStreet
The 365-day MVRV ratio suggests that this crash may be just the beginning. If the ETF is rejected before the second quarter of 2024, it could trigger a sharp correction.
placeholder
Japanese Yen stands tall near one-month top against USD on hawkish BoJ talksThe Japanese Yen (JPY) rallied to the highest level since early February against its American counterpart on Friday amid bets for an imminent shift in the Bank of Japan's (BoJ) policy stance.
Author  FXStreet
The Japanese Yen (JPY) rallied to the highest level since early February against its American counterpart on Friday amid bets for an imminent shift in the Bank of Japan's (BoJ) policy stance.
placeholder
Natural Gas sinks to pivotal level as China’s demand slumpsNatural Gas price (XNG/USD) edges lower and sinks to $2.56 on Monday, extending its losing streak for the fifth day in a row. The move comes on the back of China cutting its Liquified Natural Gas (LNG) imports after prices rose above $3.0 in June. It
Author  FXStreet
Natural Gas price (XNG/USD) edges lower and sinks to $2.56 on Monday, extending its losing streak for the fifth day in a row. The move comes on the back of China cutting its Liquified Natural Gas (LNG) imports after prices rose above $3.0 in June. It
goTop
quote